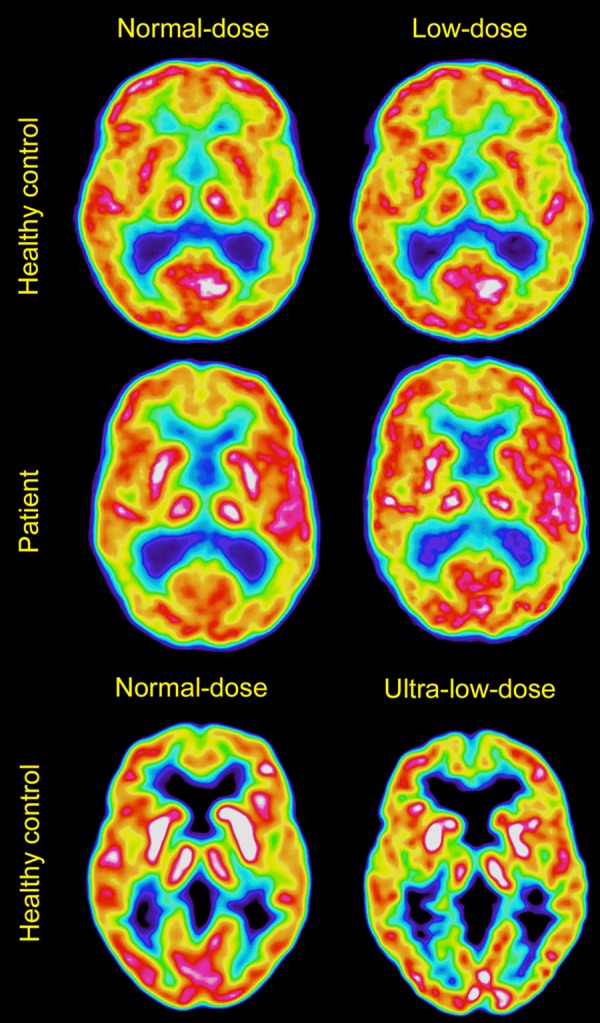
Figure 1.

Sample images. Shows a healthy control (subject 4, top row), and a patient with Alzheimer’s disease (subject 19, middle row), with normal-dose images to the left and low-dose images to the right. The bottom row shows normal- and ultra-low-dose images from a healthy control (subject 10). Images are produced with VOIager, using Sokoloff color scheme.
