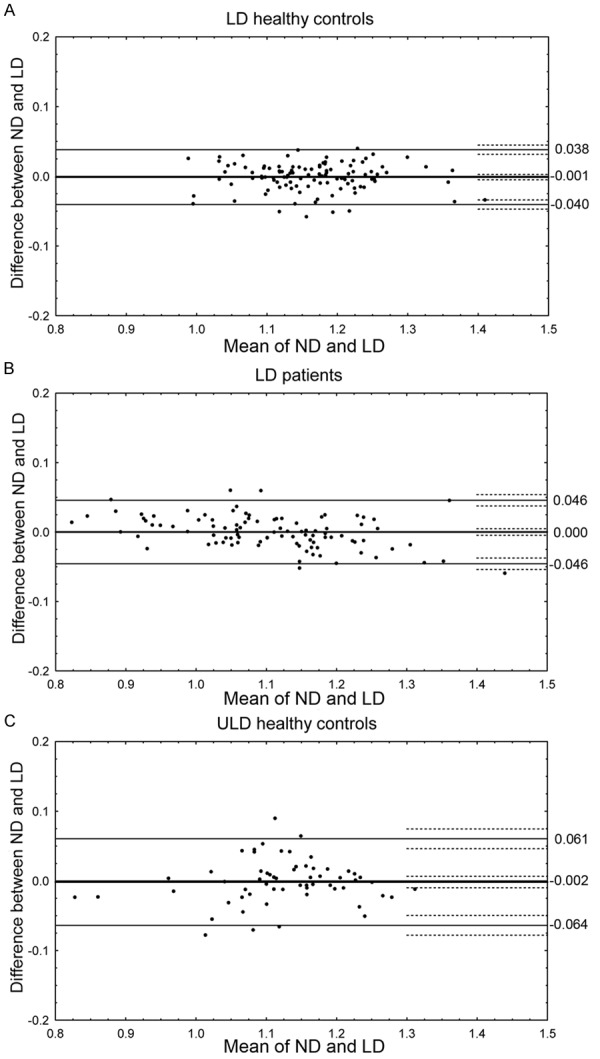
Figure 2.

(A-C) SUV-r differences by group. (A-C) show Bland-Altman plots of regional SUV-r values from low-dose controls (A), low-dose dementia patients (B), and ultra-low-dose controls (C). Thick lines represent the bias and the adjacent dashed lines the confidence limits of the bias. Thin lines represent the upper and lower 1.96 standard deviation range and the adjacent dashed lines the confidence limits of the range. (Note: the two low SUV-r values in C originate from the occipital cortex).
