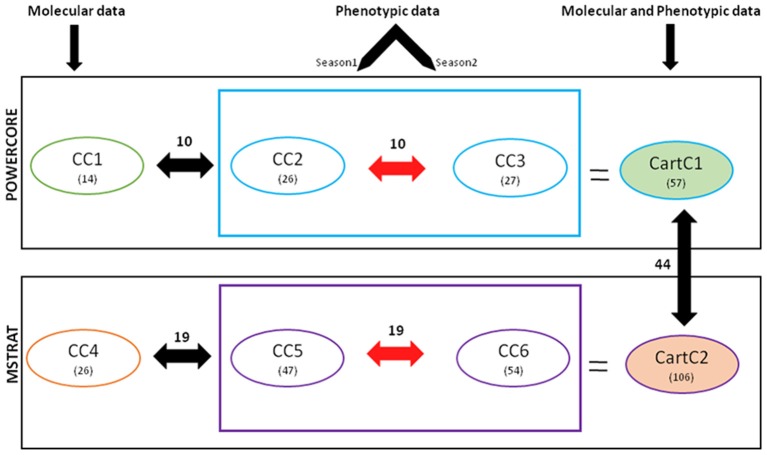
Figure 3.
Flowchart describing the strategy and results of development of core collection for safflower. Numerical values in parenthesis indicate the number of accessions in respective cores. Values indicated above the double-headed arrows depict the number of accessions common between different core collections.

