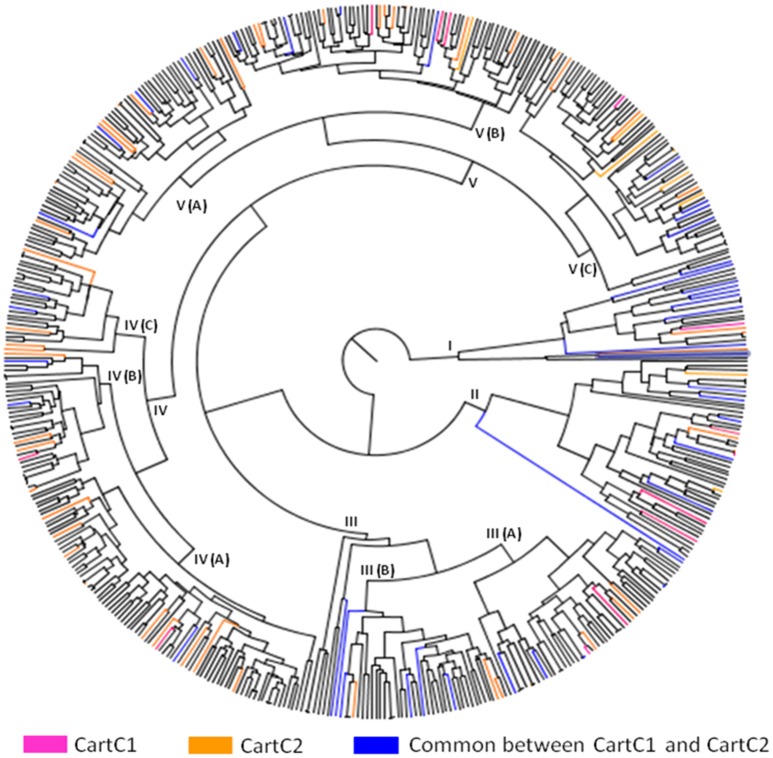
Figure 5.
Distribution of accessions of composite core collections (CartC1 and CartC2) in different clusters of UPGMA dendrogram (morphological data). Accessions unique to CartC1 and CartC2 are represented by pink and orange color, respectively. Accessions common between these two collections are represented by blue.

