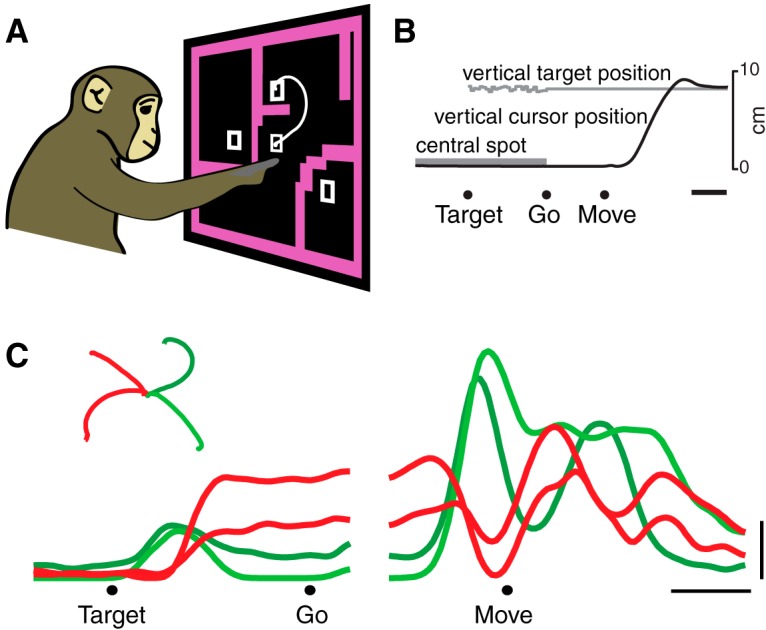
Figure 1.

Task and basic neural responses. A, B, Illustration of the maze task. Monkeys executed reaches that avoided any intervening barriers. The task was performed with a cursor presented just above the monkey’s hand. White trace shows the path of the cursor on one trial. Target, Target onset; Go, go cue; Move, movement onset. C, PSTH for an example neuron for four (of 27) conditions. Each trace shows the trial-averaged firing rate for one reach condition (one unique maze) over time. Averaging was performed twice: locked to target onset (left traces) and movement onset (right traces). Only trials with a 500 ms delay were included. Inset, Reach trajectories, colored the same as their corresponding neural traces. This neuron illustrates the transition between stable preparatory activity and rapidly changing movement-related activity. Scale bars: B, C, horizontal, 200 ms; C, vertical, 10 spikes/s.
