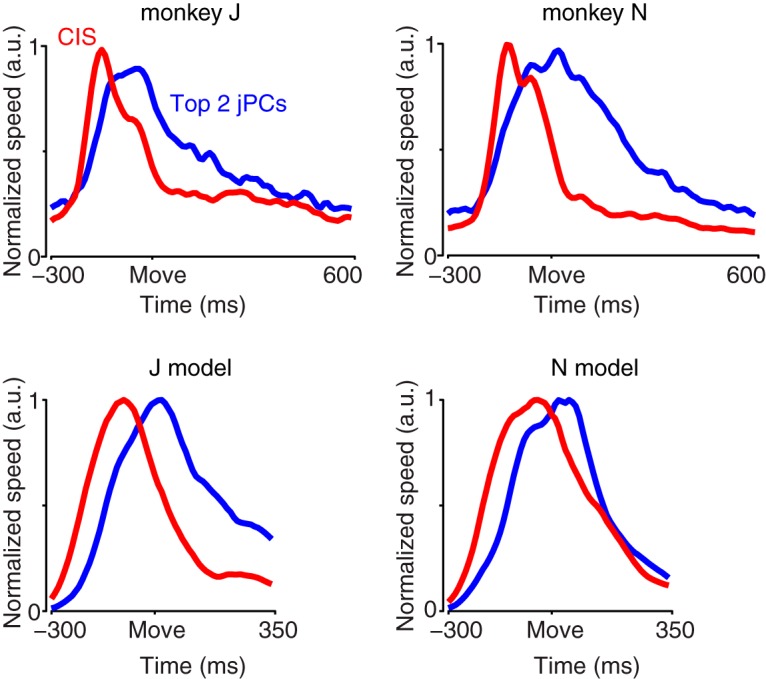
Figure 11.

Comparison of the temporal profile of the trajectory of the CIS and the temporal profile of the condition-specific rotational patterns. The vertical axis plots “neural speed”: the rate of change of the neural state in the condition-invariant dimensions (red) and in the first jPCA plane (blue), which captures the strongest rotations. The rate of change was computed separately for each condition, then averaged across conditions. For each dataset that average was normalized by its maximum. For statistical power, results for the neural data were averaged across the three datasets for each monkey. Move, Movement onset. Note that because the data have been smoothed and differentiated, the first moment when the state begins to change is shifted leftwards: the CIS appears to begin changing >200 ms before movement onset, when ∼150 ms is a more accurate estimate (Fig. 3). Since both the condition-invariant dimensions and the jPCA dimensions are processed in the same way, however, their relative timing can be compared.
