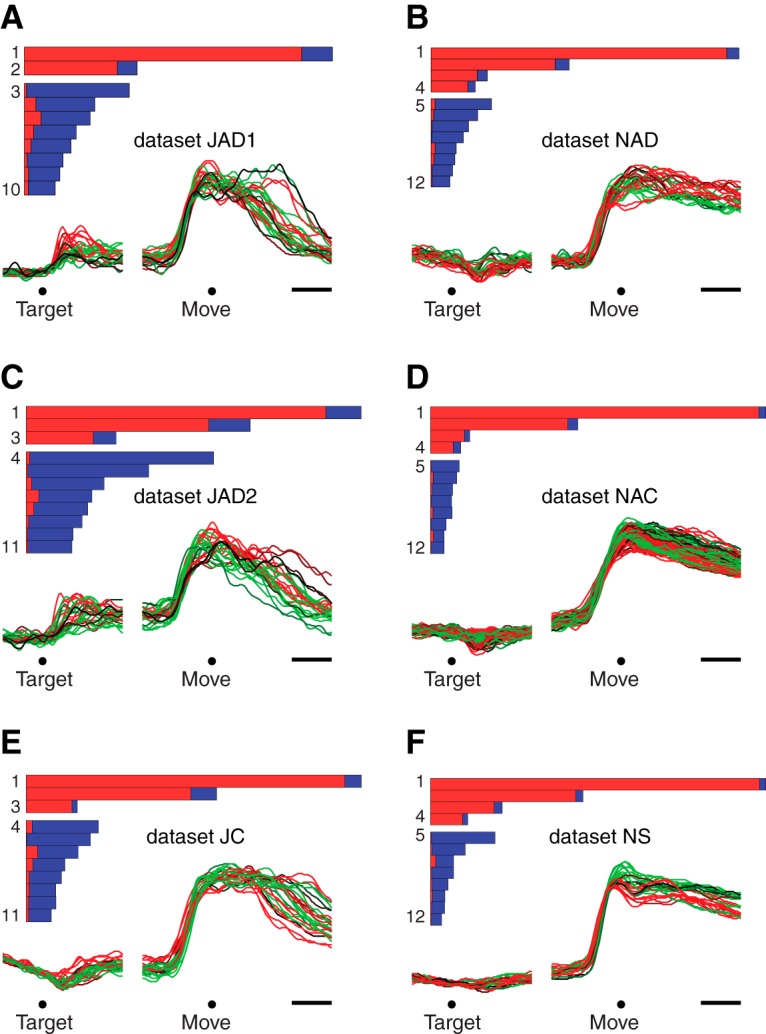
Figure 3.

Performance of demixing on the empirical data. A. Bars show the relative variance captured by each dPCA component for dataset JAD1. Each bar’s horizontal extent indicates the total variance captured by that component. The red portion indicates condition-invariant variance, while the blue portion indicates condition-specific variance. Components are grouped according to whether they were overall condition-invariant (top group, >50% condition-invariant variance) or condition-specific (bottom group, >50% condition-specific variance). Traces show the projection onto the first dimension found by dPCA (CIS1) versus time. Each trace corresponds to one condition. Target, target onset; Move, movement onset. Scale bars, 200 ms. B—F. Same as A, for the remaining datasets.
