Figure 8.

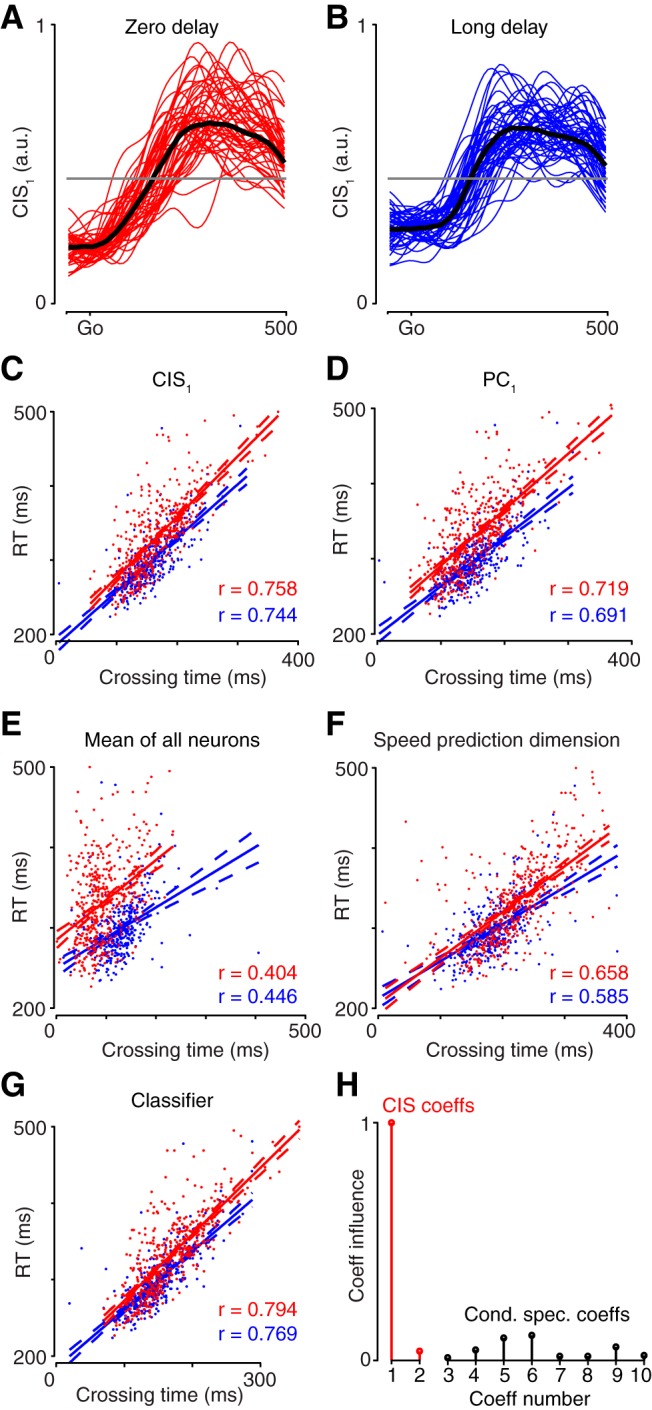
Predicting RT using projections of the data for dataset JAD1. A, Each trace plots CIS1 over time on a single zero-delay trial. Fifty trials selected randomly at intervals throughout the day are shown. Black trace plots the median across all trials. B, Same as in A but for trials with a 500 ms delay period (long delay). The criterion value (gray line) was chosen using long-delay trials. The same value was used for zero-delay trials (A). C–G, Correlation of behavioral RT with the time when the neural criterion value was crossed. For each panel, data are shown for both long-delay trials (blue) and zero-delay trials (red). Lines show linear regressions; dashed lines show 95% confidence bounds of the fit. Each panel in C–G gives the correlation for a different linear projection of the population response: CIS1 (C), the projection onto the first PC (D), the mean over all neurons (E), the projection onto the dimension that best reconstructed speed according to a linear regression (F), and the projection onto the axis found by a logistic regression classifier (G). Trials where the neural data did not cross the criterion value were excluded. H, Coefficient influence for the classifier. Coefficients for condition-invariant dimensions shown in red; condition-specific dimensions shown in black.
