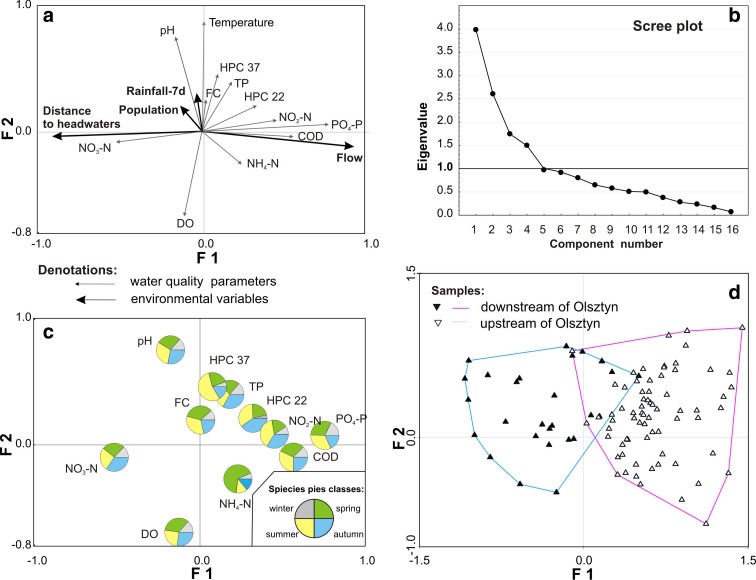
Fig. 3.
Results of principal component analysis performed with the environmental variables and water quality data along the Łyna River (P ≤ 0.05). a Biplot of significant environmental variables and water quality data related to factor 1 (F1) and factor 2 (F2). b Scree plot for eigenvalues. c Pie charts showing the share of each parameter values in each season. d Plot of the samples’ distribution. Two distinct groups of samples have been selected: blue area with black triangles is related to the unpolluted river section, and red area with white triangles denotes the anthropogenically polluted river section

