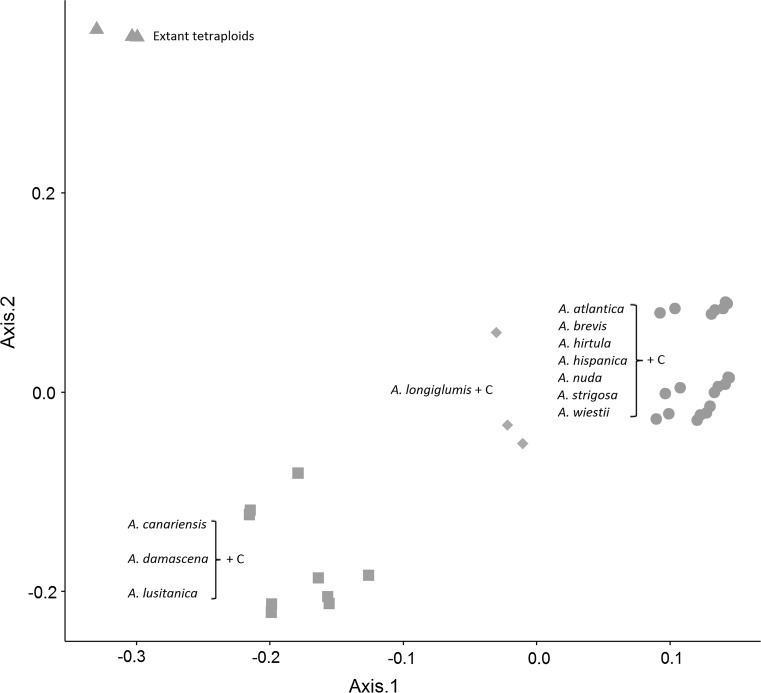
Fig. 3.
PCoA analysis including all extant AC (DC) tetraploids and theoretical in silico tetraploid species generated by combining tag counts from A-genome diploid plus C-genome diploid combinations. The symbols and colours represent in silico combinations that clustered together, as labelled. The green triangles represent all extant AC (DC) tetraploid species analysed in this study (colour figure online)

