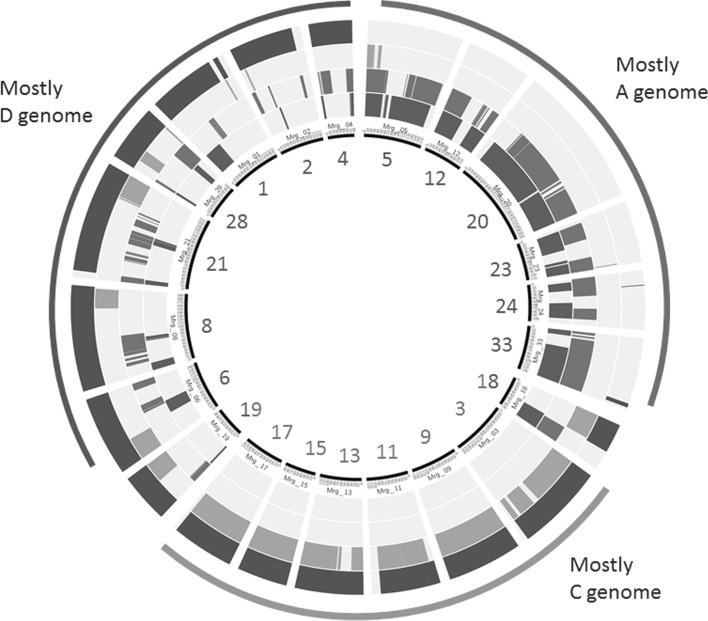
Fig. 4.
E-painting of chromosome representations in the hexaploid oat consensus map. The 21 chromosome representations with Mrg identification numbers described by Chaffin et al. (2016) are shown as elements of the circle, scaled by cM distance, and ordered by inferred genome origin. Four concentric rings of different colours indicate which chromosomes within the map contain a relatively high frequency of matches to the ancestral group represented by the respective ring: blue (innermost ring) represents A-genome diploids; red (second ring) represents the Ac/d-variant genome of the group containing A. canariensis, A. damascena and A. lusitanica; orange (third ring) represents C-genome diploids; and green (outermost ring) represents AC (DC)-genome tetraploids. The three outermost arcs are an interpretation of the genome contributions to the majority of chromosomes within each arc, based on hybridization pattern to the ancestral genomes (colour figure online)

