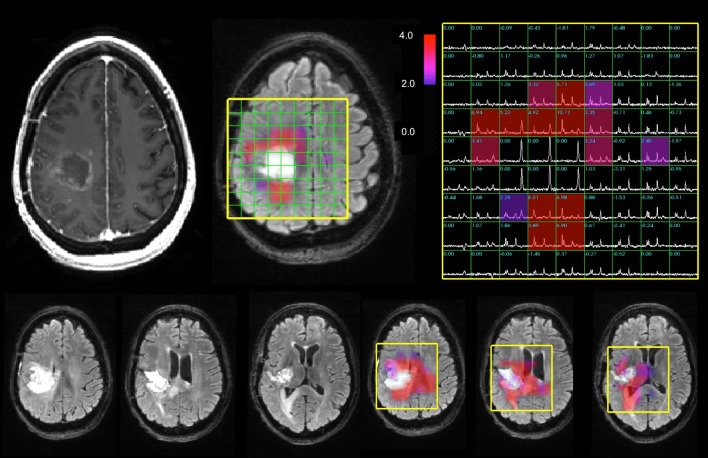
Fig. 1.
Anatomic images, spectra and CNI color overlays from the Fup1 scan for a 47 year old female patient with a KPS of 90, sub-total resection, a low PFS of 159 days and a low OS of 206 days. The CNI maps were thresholded to show only values that were 2 or higher in order to highlight the metabolic lesion. The median and maximum CNI were 4.8 and 19.9. Note the high lipid peaks in the cavity, which are surrounded by areas with increased choline and decreased NAA that corresponded to the metabolic lesion. The residual CE volume was 3 cm3 is minimal and corresponds mainly to a thin rim around the resection. The volume of the T2 lesion at this time point is 29 cm3. As is shown from the FLAIR images and CNI overlays from the three lower slices, the metabolic lesion is relatively large and gives a clear picture of regions that are likely to reflect recurrent/residual tumor

