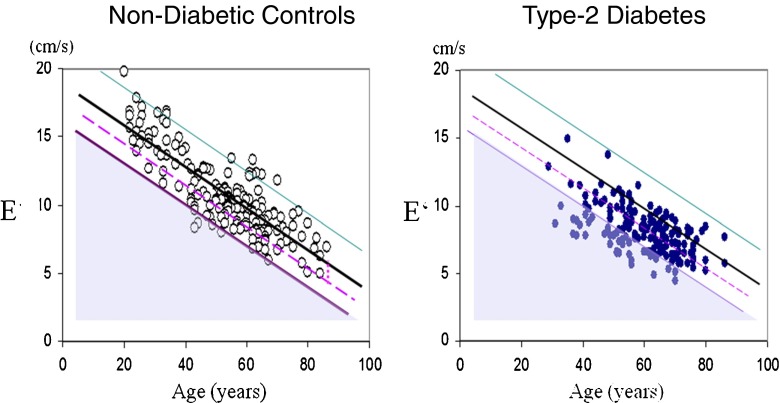
Fig. 2.
Diastolic myocardial function E’ as function of age in non-diabetic controls (left) and type-2 diabetes (right) with the regression line (black) and upper and lower tolerance intervals (purple and green) from healthy controls. Diastolic dysfunction is defined as difference E’ – E’norm on the regression line >2.86 (shaded triangle) and risk for diastolic dysfunction if the deficit is >50 % of this cut off level (between the dashed line and the lower tolerance line) (modified from [21••])

