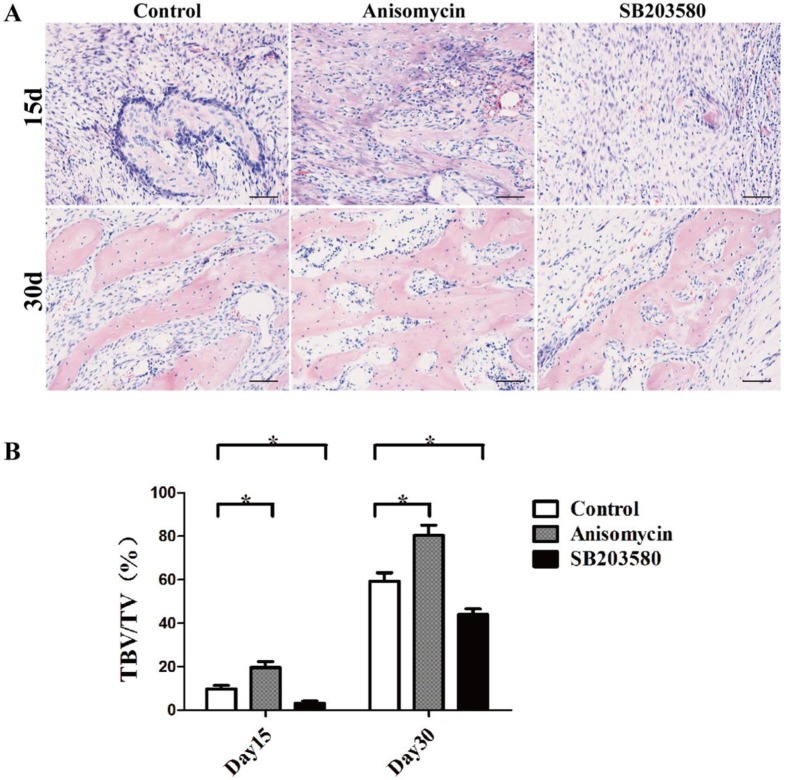
Figure 4.
Histology and histomorphometric analysis of each group. (A) HE photographs of day 15 and day 30. (B) Trabecular bone volume/ total volume analysis. Images were taken in 5 randomly selected high magnification fields (200×) per slide under a microscope. The new bone formation in the distraction gap was quantified with the ratio of trabecular bone volume/total volume using Image Pro-Plus analysis software by an experienced pathologist. Bar = 50 μm.

