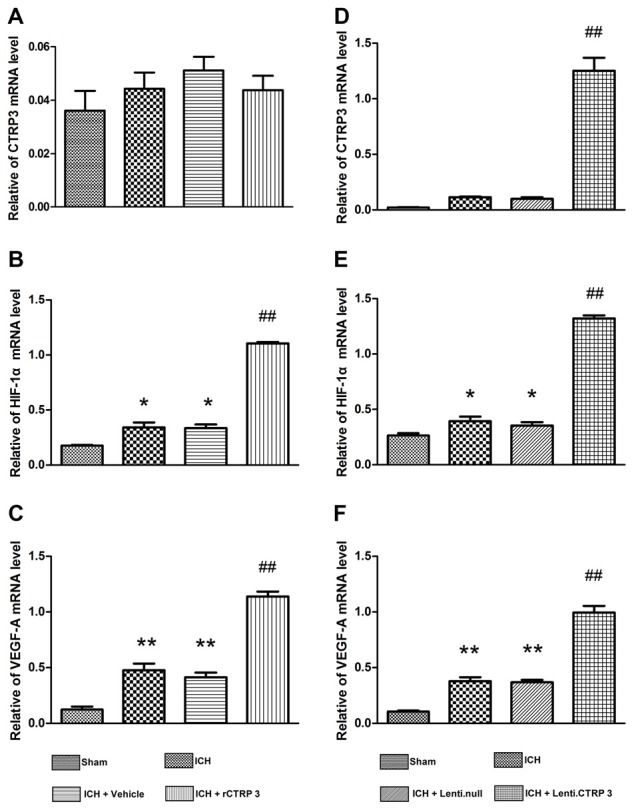
Figure 6.

Quantitative RT-PCR analysis of HIF-1α and VEGF-A mRNA levels in the hematoma border zone 7 days after ICH. (A–C) Quantitative RT-PCR analysis of the effect of rCTRP3 on CTRP3, HIF-1α and VEGF-A mRNA levels. (D–F) Quantitative RT-PCR analysis of the effect of rCTRP3 on CTRP3, HIF-1α and VEGF-A mRNA levels. Values are mean ± SEM. n = 4–6 per group. *p < 0.05 vs. sham; **p < 0.01 vs. sham; ##p < 0.01 vs. vehicle or Lenti.null. CTRP3, C1q/tumor necrosis factor-related protein-3; rCTRP3, recombinant CTRP3; Lenti.CTRP3, Lentivirus overexpression of CTRP3; ICH, intracerebral hemorrhage.
