Figure 1.
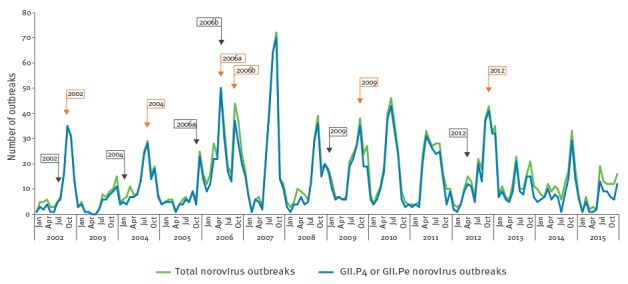
Norovirus gastroenteritis outbreak periodicity, Victoria, Australia, 2002–15 (n = 2,473)
Monthly number of norovirus gastroenteritis outbreaks in the State of Victoria, Australia, from 2002 to 2015 (based on ORF1 reverse transcription (RT)-PCR data). The total number of norovirus outbreaks is shown, as well as the outbreaks where GII.P4 or GII.Pe (ORF1) was detected. It is notable that in most years an epidemic peak occurred in the latter half of the year (spring–summer in Australia). An epidemic ‘peak’ was considered to be three consecutive months of the highest number of norovirus gastroenteritis outbreaks in a calendar year, except in 2006 where there were two epidemic peaks of similar size [14]. Black arrows indicate the first detection of a new epidemic GII.4 variant (Farmington_Hills_2002, Hunter_2004, Yerseke_2006a, Den Haag_2006b, NewOrleans_2009 and Sydney_2012). Orange arrows indicate the first epidemic peak caused by a new epidemic GII.4 variant. This graph makes use of sequencing information from previous studies in our laboratory [11,14] as well as inclusion of novel data.

