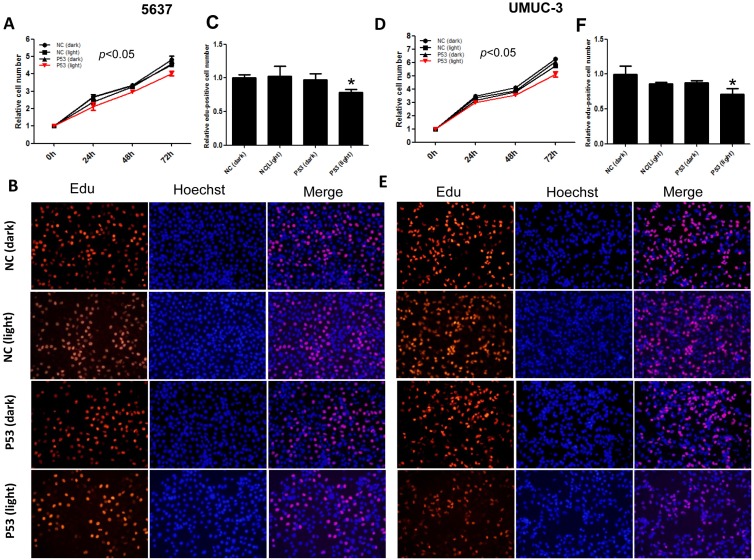
Figure 3.
Inhibition of bladder cancer cell proliferation by light-induced P53 expression. The growth curves of 5637 (A) and UMUC-3 cell (D) treated with induced P53 under continuous illumination (0.84 W/m2; 1s:30s) were monitored by CCK-8 assay; The proliferation of 5637 (B) and UMUC-3 cell (E) were monitored by Edu staining assay; Relative Edu-positive cell number in 5637 (C) and UMUC-3 cell (F) under different treatment were statistically analyzed. Data were shown as mean ±SD; *, p<0.05.

