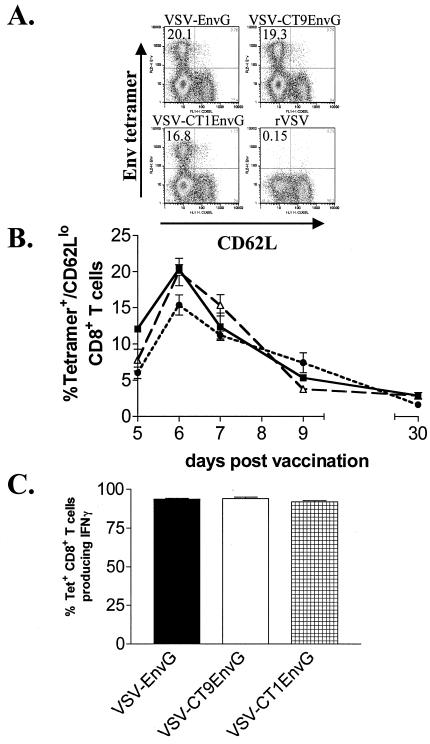
FIG. 3.
Detection of antigen-specific CD8+ T cells after i.p. vaccination. Mice were vaccinated i.p. with VSV-EnvG, VSV-CT9EnvG, or VSV-CT1EnvG. Splenocytes were isolated and stained with anti-CD8, Env tetramer, and anti-CD62L. (A) Representative fluorescence-activated cell sorter (FACS) plots (pregated on CD8+ T cells) at 6 days postvaccination for the indicated viruses. Numbers in the upper left corner of each plot indicate the percentage of CD8+ T cells that were Env tetramer+ and CD62Llo. (B) Graph of the percentages of Env tetramer+ CD62Llo CD8+ T cells at the indicated days postvaccination with VSV-EnvG (filled squares), VSV-CT9EnvG (open triangles), or VSV-CT1EnvG (filled circles). Error bars are the standard error of the mean (three to five mice per point). Background from mice vaccinated with rVSV (≥0.40%) was subtracted in each case. (C) Analysis of IFN-γ production by intracellular cytokine staining. Seven days postvaccination, splenocytes were isolated and analyzed for intracellular IFN-γ production. Bars represent the percentage of tetramer-specific CD8+ T cells producing IFN-γ upon stimulation ± the standard error of the mean. At least three animals were analyzed for each time point.

