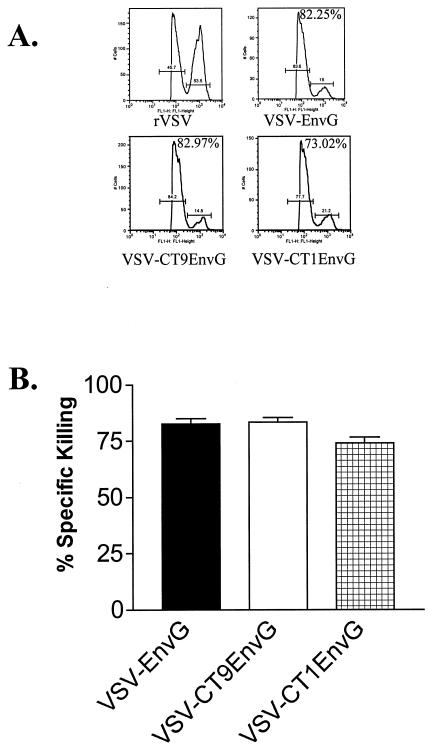
FIG. 4.
Quantitation of cytotoxic T-cell killing in vivo after i.p. vaccination. Mice were inoculated i.p. with rVSV (n = 3), VSV-EnvG (n = 3), VSV-CT9EnvG (n = 3), and VSV-CT1EnvG (n = 3). At 7 days postvaccination, mice were injected i.v. with two populations of splenocytes from naïve mice. One population was loaded with p18-I10 Env peptide and labeled with a high concentration of CFSE, and the other population was not loaded with peptide and was labeled with a low concentration of CFSE. (A) Representative FACS histograms for each group. (B) Percentages of CFSEhi and CFSElo seen in mice that had been infected with rVSV (53.5 and 45.7%), VSV-EnvG (15 and 83.6%), VSV-CT9 EnvG (14.5 and 84.2%), and VSV-CT1EnvG (21.2 and 77.7%) were used to calculate percent specific killing. Percent specific killing of peptide-loaded cells in vaccinated mice was obtained as described in Materials and Methods. Mice vaccinated with rVSV were used as a control. The bars show the average percent specific killing for each group. Error bars indicate standard errors of the means.

