
Figure 7.
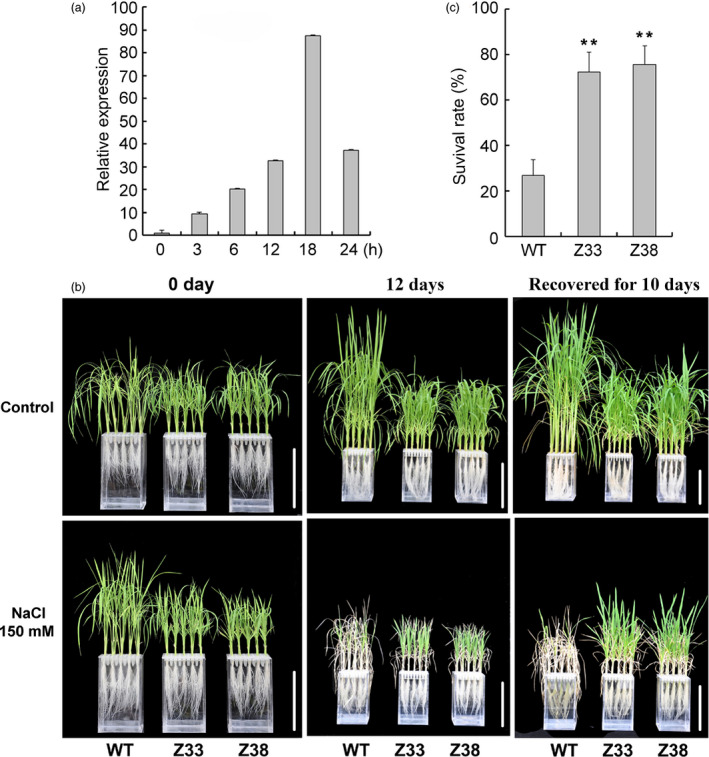
Expression PtCYP714A3 in response to high‐salinity and salt stress tolerance analyses of transgenic rice plants. (a) Expression of PtCYP714A3 is responsive to NaCl stress. Poplar leaves were cut into sections and divided into several groups that were treated separately with 200 mm NaCl for different time points. Samples were collected at 0, 3, 6, 12, 18 and 24 h after the initiation of treatment. Data represent the average of three independent experiments. (b, c) Phenotypes (b) and survival rates (c) of three‐week‐old seedlings of wild‐type and PtCYP714A3 transgenic plants treated with 150 mm NaCl for 12 d followed by 10 days of recovery without NaCl. WT, wild type; Z33 and Z38, independent transgenic lines. Values are means ± SD (n = 4) from three independent experiments. Asterisks indicate statistically significant difference in comparison with the WT (Student's t‐test, **, P < 0.01).