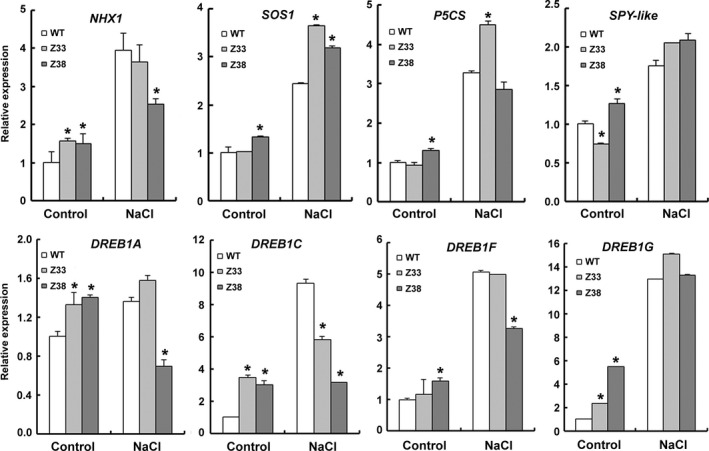
Figure 9.

Quantitative real‐time PCR analyses of salt tolerance‐related marker genes. Three‐week‐old seedlings treated with 150 mm NaCl for 12 h or 0 h (Control) were harvested for total RNA extraction, transverse transcription and real‐time PCR analyses. WT, wild type; Z33 and Z38, independent transgenic lines. Values are means ± SD of three biological replicates from the WT or the transgenic lines. Asterisks indicate statistically significant difference in comparison with the WT (Student's t‐test, *, P < 0.05). The TIGR loci of these genes are as follows: NHX1 (Os07g0600900); SOS1 (Os12g0641100); P5CS (Os05g0455500); SPY‐like (Os08g0559300); DREB1A (Os09g35030); DREB1F (Os01g73770); DREB2A (Os01g07120).
