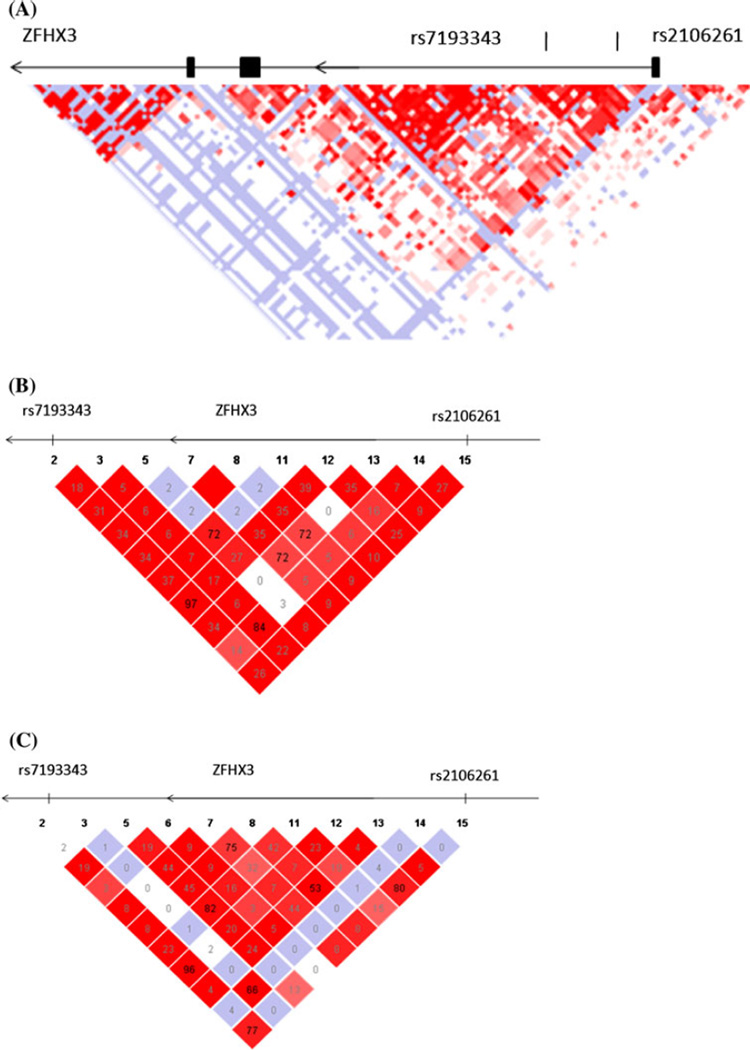
Fig. 1.
a Overview of linkage disequilibrium (LD) of the 160 kb region around intron 1 of ZFHX3. The LD structure around SNPs rs7193343 and rs2106261 was derived from the genotyping data of SNPs from the HAPMAP database (http://www.hapmap.org, phase 2, HapMap-CEU). The pairwise correlation between SNPs was measured as D′ and a black diamond without a number refers to D′ = 100. Exons are marked with black boxes. The direction of ZFHX3 transcription is to the left as marked by the arrows. b LD structure between SNPs rs7193343 and rs2106261 predicted based on the HapMap data for the Chinese population (http://www.hapmap.org, phase 2, HapMap-HCB). c LD structure between SNPs rs7193343 and rs2106261 predicted based on the HapMap data for the population of European ancestry (http://www.hapmap.org, phase 2, HapMap-CEU)

