
Figure 4. Global transcriptome distances in substrate responses of B. longum SC596 to human milk oligosaccharides.
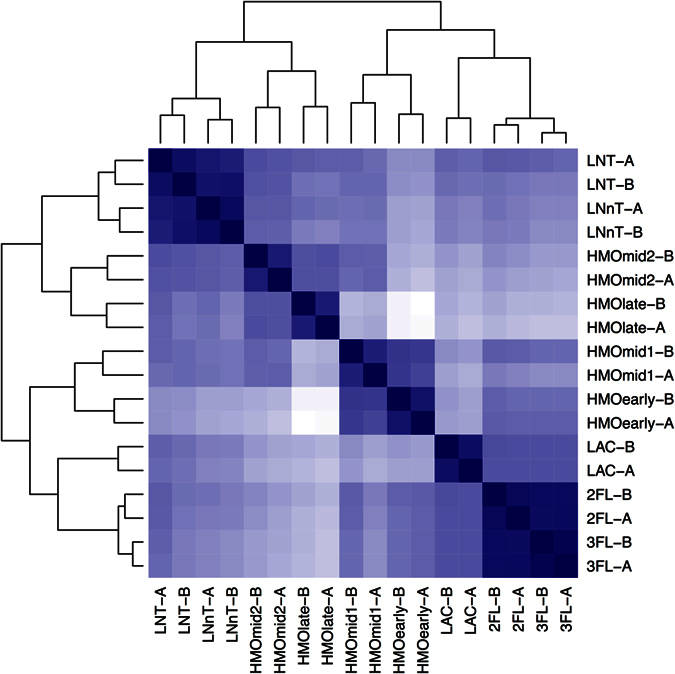
The heatmap shows the distances between the whole transcriptomes in response to LNT, LNnT, lactose (LAC), 2FL, 3FL, and four time points during HMO growth (early, mid1, mid2, late). Each experiment on each substrate was done in duplicate (i.e. samples ‘A’ and ‘B’). Branches represent the Euclidean distances of the whole transcriptomes after variance-stabilization of the count data. The intensity of the blue color in the heatmap indicates the degree of similarity, from white (dissimilar) to dark blue (most similar). Likewise, the dendograms also show the distances with larger branch lengths indicating greater distances.