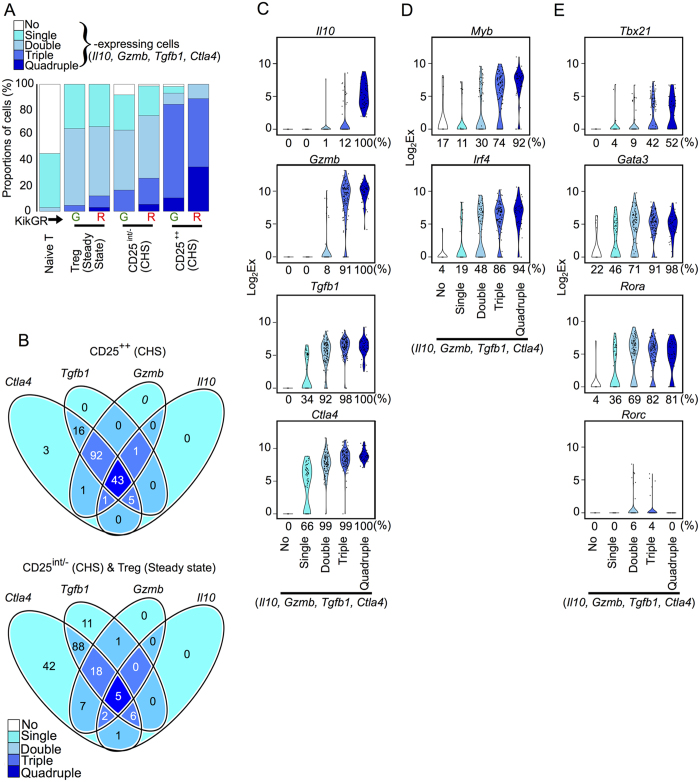
Figure 2. Gzmb and Il10 are dominantly expressed in Tregs expressing multiple genes associated with Treg effector molecules.
(A) The proportions of individual Tregs or naive T cells co-expressing the genes Il10, Gzmb, Tgfb1, and Ctla4. (B) Venn diagrams showing the numbers of individual cells with co-expression of the genes Il10, Gzmb, Tgfb1 and Ctla4 among CD25++ Tregs in CHS (upper) or CD25int/− Tregs in CHS and Tregs in steady state (lower). (C,D,E) Violin plots showing expression levels of the genes Il10, Gzmb, Tgfb1 and Ctla4 (C), Myb and Irf4 (D), and Tbx21, Gata3, Rora and Rorc genes (E) in individual no-, single-, double-, triple- and quadruple-expressing cells (n = 23, 70, 115, 125 and 48, respectively). Percentages under each plot indicate the proportion of cells that expressed the gene.

