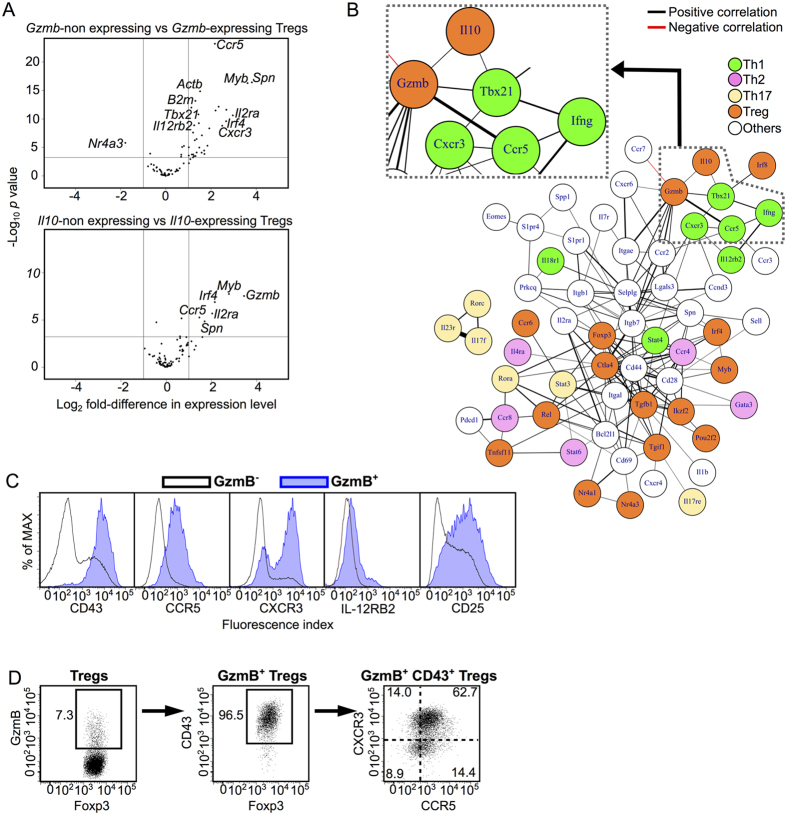
Figure 3. CD43, CCR5 and CXCR3 are markers for Gzmb+ Tregs.
(A) Volcano plots indicating genes differentially expressed between non-Gzmb-expressing and Gzmb-expressing Tregs (upper) and between non-Il10-expressing and Il10-expressing Tregs (lower) under CHS condition. Vertical lines indicate a two-fold change in expression. Horizontal lines indicate p = 0.001. Selected genes that had statistically significant differences in expression between subsets are labeled. (B) A correlation network constructed using scqPCR data from CD25int/− Tregs in CHS (Spearman’s rank correlation coefficient, ρ > 0.3). Genes are colored according to their function. Line colors indicate positive (black) or negative (red) correlations. Line thickness indicates correlation coefficient (a thicker line indicates a higher correlation coefficient). (C) CD43, CCR5, CXCR3, IL-12RB2 and CD25 protein expression in GzmB+ and GzmB– Treg subsets isolated from the dLN of CHS mice. (D) CD43, CCR5, and CXCR3 protein expression in GzmB+ Treg subsets in the dLN. Flow cytometry data are representative of three independent experiments; values on the plots indicate the percentage of the parent population.

