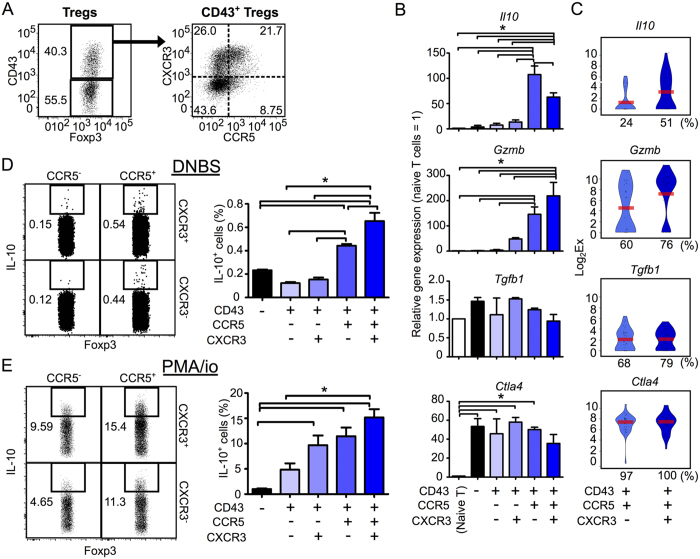
Figure 4. CD43+ CCR5+ Tregs are a major subset of Gzmb-/IL10-expressing Tregs.
(A) Flow cytometry gating strategy for five Treg subsets (CD43− and CD43+ CCR5+/− CXCR3+/− Tregs) isolated from the dLN of CHS mice. (B) The population-wide expression levels of the genes Il10, Gzmb, Tgfb1 and Ctla4 genes within CD43− and CD43+ CXCR3+/− CCR5+/− Treg subsets, relative to expression levels in naive T cells (n = 3). (C) Violin plots showing expression levels of the genes Il10, Gzmb, Tgfb1 and Ctla4 genes in individual Tregs in the CD43+ CCR5+ CXCR3− or CXCR3+ subsets (n = 37 each). Bars indicate average expression levels. Percentages under each plot indicate the proportion of cells that expressed the gene. Figures 4C and 5A show scqPCR data for CD43+ CCR5+ CXCR3− or CXCR3+ Tregs. (D,E) The proportions of IL-10-producing cells in Treg subsets (n = 3) stimulated with DNBS (D) or PMA/ionomycin (E). Flow cytometry dot plots indicate IL-10 expression in the CD43+ CXCR3+/− CCR5+/− Treg subsets. Flow cytometry data are representative of three independent experiments; values on the plots indicate the percentage of the parent population. Data in bar graphs represent means ± SEM. Statistical comparisons were performed by one-way ANOVA with Tukey’s post-hoc test (*p < 0.05).

