
Figure 5. Correlative analysis of circadian rhythmicity with the metabolic phenotype of the donor.
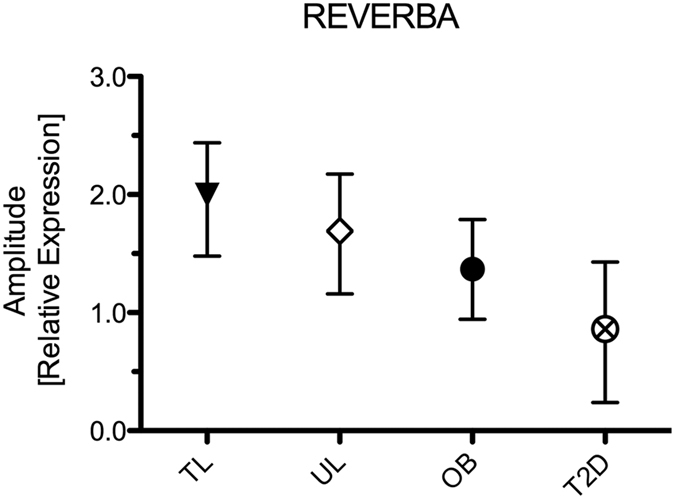
The plot displays the association (Spearman’s Rho test for nominal data) between the metabolic phenotype of the donor with the amplitude of the JTK_CYCLE based peak and nadir for REVERBA. Data are relative expression amplitude with 95% CI as error bars.