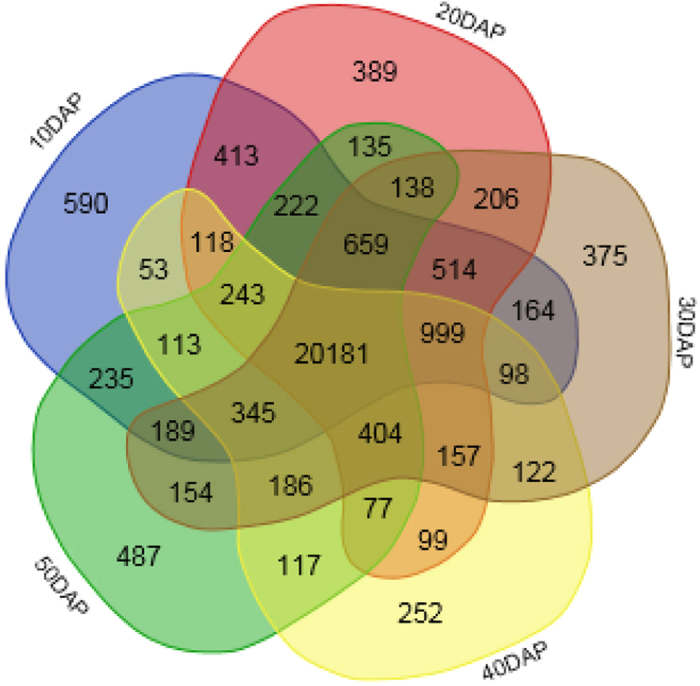
Figure 3. Venn diagram showing the number of gene detected in five different development stages.

Each set represent a stage of development. Numbers in each intersection represent the number of genes detected with at least one read (gene tag) in these disjoint sets (intersections).
