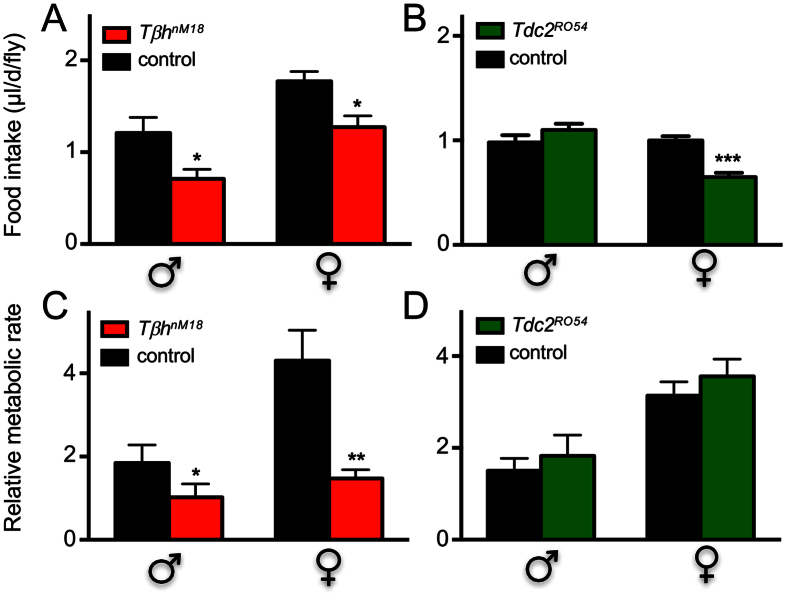
Figure 3. Food intake and metabolic rate of Tβh-deficient animals.
Food intake of male and female flies was quantified using the CAFE assay (A). TβhnM18 (A, red) and control (A, black), Tdc2RO54 (B, green) and control (B, black); the means of four biological replicates ± SEM are shown. Metabolic rates of cohorts of three adult flies were quantified according to Yatsenko et al.27, using TβhnM18 and their matching controls (C) or Tdc2RO54 and their matching controls (D). At least five biological replicates were analysed. Shown are mean values ± SEM. Statistics, see Fig. 1.

