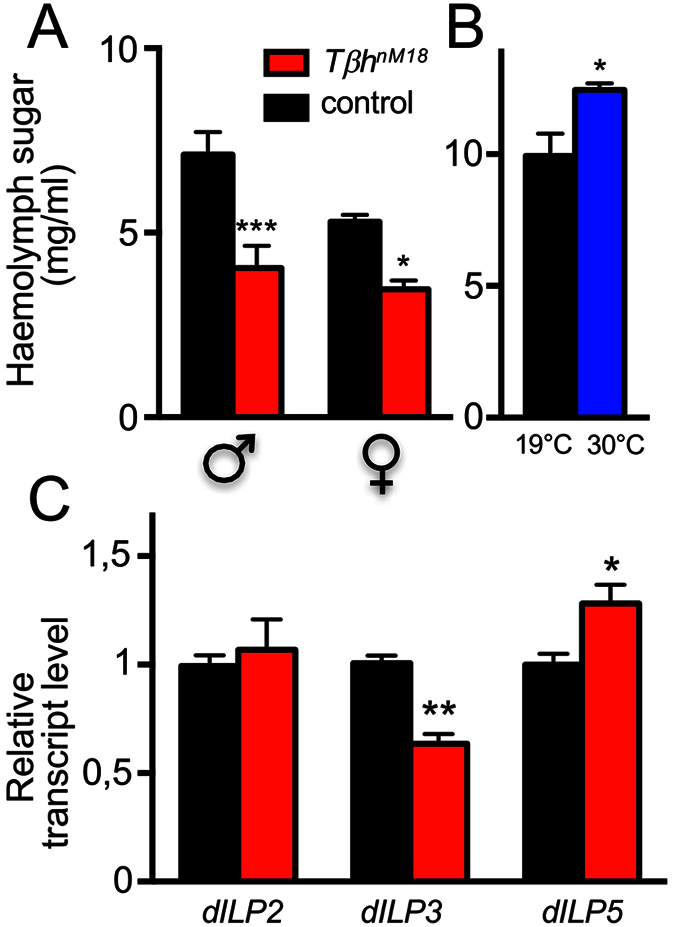
Figure 5. Haemolymph sugar and dILP transcript levels in animals with altered OA levels.

Haemolymph sugar levels in TβhnM18 (red) and matching control (black) flies shown for males and females (A). Effect of ectopic release of OA on sugar levels by the application of the permissive temperature (30 °C) to Tβh-Gal4 × UAS-TrpA1 animals compared with genetically identical animals held at the restrictive temperature (19 °C; B). Relative transcript levels of dILP2, dILP3 and dILP5 in control and TβhnM18 flies (C), mean values ± SEM of four biological replicates.
