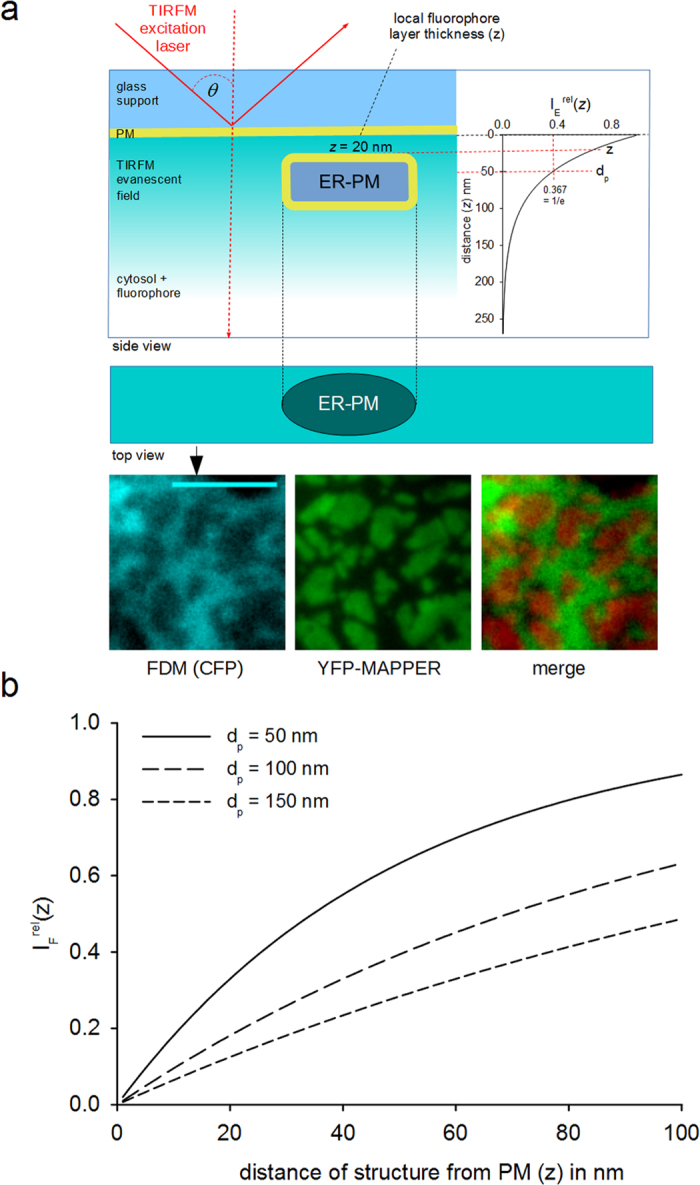
Figure 1. Fluorescence density mapping (FDM).

(a) Illustration of the theoretical concept: TIRFM illumination exclusively excites fluorophores within the surface-adherent region of the adherent cell by an evanescent wave. Heterologously expressed GFP variants display homogenous distribution in the cytosol. The thickness of the fluorophore-containing cytosolic layer (z) within the evanescent field is limited and determined by the incident angle (θ) of the laser excitation light. As the overall emission intensity depends on the local thickness of the excited fluorophore layer, any sub-plasmalemmal structure, intruding this layer will reduce the intensity at this section of the evanescent field. Consequently, non-fluorescent cellular structures within the evanescent field can be discerned as dark regions in FDM. The inserted graph shows the dependence of excitation intensity ( , relative to its maximum at the plasma membrane) on z at a given penetration depth (dp = 50 nm; indicated). Bottom: ER-PM junctions in a RBL-2H3 cell visualized by FDM (CFP, cyan) and YFP-MAPPER (green), a STIM1-based marker of ER-PM junctions. (b) Dependence of relative fluorescence emission intensity (
 , local intensity relative to a maximal value determined in a non-junctional reference point) on the distance (z) between objects intruding the evanescent field and the PM at different penetration depths (dp), as calculated by equation 1. Steepness of the curve and, thus, (z-axis) resolution depend on the penetration depth dp of the evanescent field.
