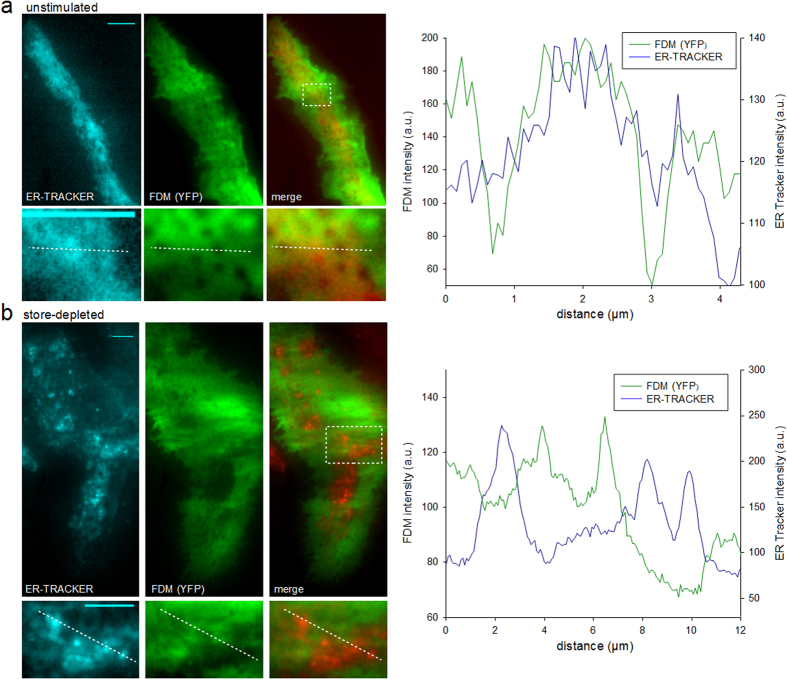
Figure 3. ER-Tracker and FDM identify ER-PM junctions in TIRFM.
(a) Top, left: TIRFM micrographs of a resting RBL-2H3 cell, labeled with ER-Tracker (glibenglamide BODIPY TR, cyan, left), expressing cytosolic YFP (green, right) and a color overlay image (merge, right). Below: Magnified details of the area indicated in top panel. Right: Intensity line-scans of ER-Tracker fluorescence (blue) and FDM intensities (green) as indicated by the dotted line in detail image. (b) Top, left: TIRFM micrographs of a stimulated (5 μM TG for 5 min in Ca2+-free buffer solution and 10 min re-addition of Ca2+-containing buffer) RBL-2H3 cell, labeled with ER-Tracker (cyan, left), expressing cytosolic YFP (green, right) and a color overlay image (merge, right). Below: Magnified details of the area indicated in top panel. Right: Intensity line-scans of ER-Tracker fluorescence (blue) and FDM intensities (green) as indicated by the dotted line in detail image. Bars = 5 μm.

