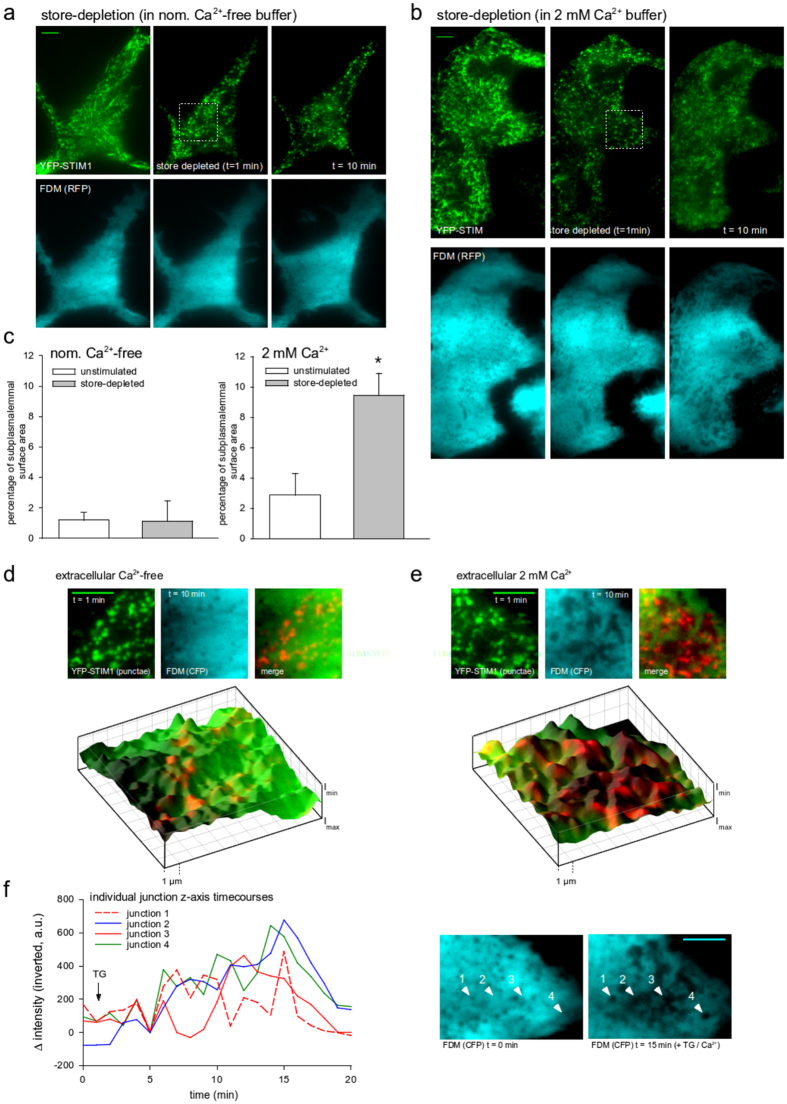
Figure 6. Formation of large junctional structures after stimulation with thapsigargin depends on extracellular Ca2+ in RBL-2H3 cells.
(a) TIRFM micrographs of YFP-STIM1 (green, top) and FDM (mCherry) (cyan, bottom) in RBL-2H3 cells before (left), just after store depletion (center) and 10 min after stimulation (right) in absence of extracellular Ca2+. (b) YFP-STIM1 (green, top) and FDM (mCherry based) (cyan, bottom) of RBL-2H3 cells before (left), just after store depletion (center) and 10 min after stimulation (right) in presence of 2 mM extracellular Ca2+. (c) Mean percentage (±S.E.M., N = 5 cells) of TIRF junction surface area in unstimulated (white bar) and store-depleted RBL-2H3 cells (grey bar) in absence (left) or presence of 2 mM Ca2+. Asterisk indicates statistical significance (t-test). (d,e) Detail image sections as indicated in (a). Top: YFP-STIM1 punctae (t = 1 min, green), FDM junctions (t = 10 min, cyan) and color overlay (right) in absence of extracellular Ca2+. Bottom: 3D reconstruction of sub-plasmalemmal organelle surface within the evanescent field based on FDM and superimposed color merge image displaying localization of YFP-STIM1 clusters. Imin corresponds to position of the PM cytoplasmic surface. (f) Time-courses of inverted mean intensity in individual junctions of a single cell (relative to a non-junctional cytosolic reference point) in presence of 2 mM extracellular Ca2+. Store depletion is indicated by arrow. Right: Positions of junctions as indicated left before (t = 0 min) and after stimulation in presence of 2 mM extracellular Ca2+ (t = 15 min). Bars = 5 μm. Image RGB colors were set to cyan for better visibility of FDM structures.

