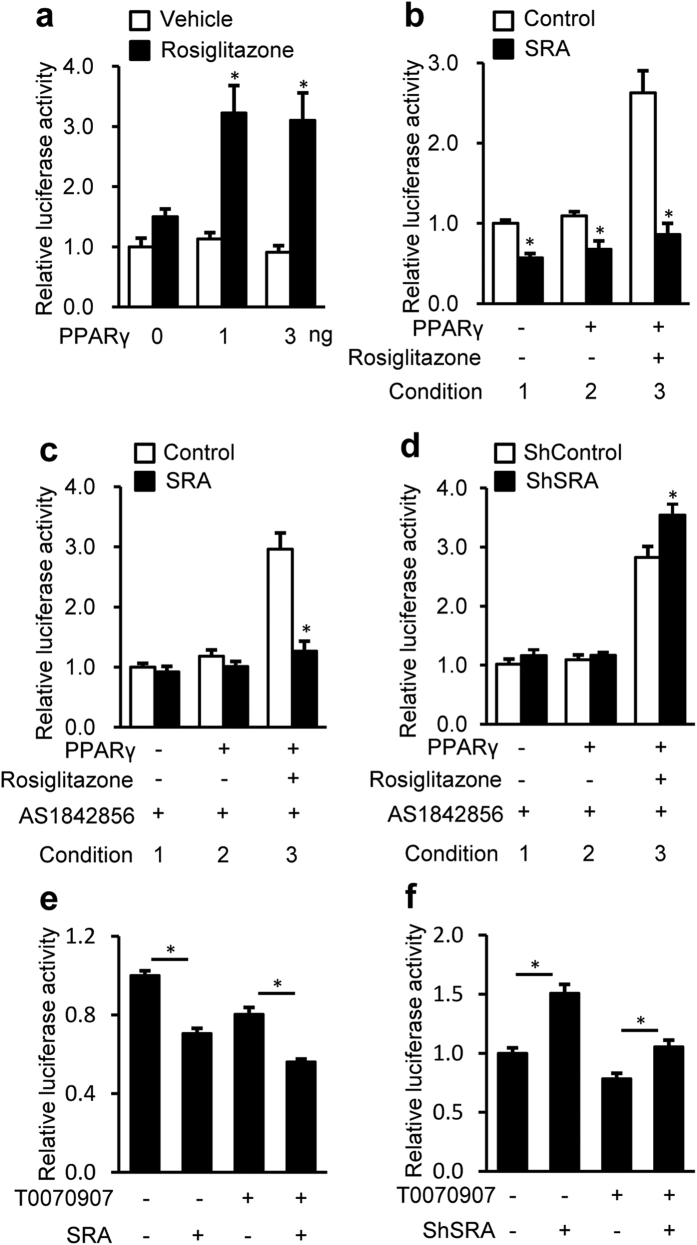
Figure 6. SRA inhibits PPARγ-mediated ATGL promotor driven luciferase activity.
Cells were transfected with −3000/+ 1-LUC ATGL construct (200 ng) and pRL-TK-Renilla (10 ng). (a–d) PPARγ expression vector was cotransfected. 36 h after transfection, cells were treated with rosiglitazone (1 μM) for 24 h before harvesting. (a) HepG2 cells were transfected by PPARγ expression vector with the dose indicated. (b) pSCT-SRA or control expression vector (200 ng) plus PPARγ expression vector (3 ng) were transfected into HepG2 cells. (c) Similar to (b), except with AS1842856 (1 μM) treatment immediately after transfection. (d) Hepa1-6 cells were infected with shRNA against SRA (shSRA) or scrambled shRNA as control (shControl). 12 h later, PPARγ expression vector (3 ng) was transfected into Hepa1-6 cells. AS1842856 (1 μM) treatment was started immediately after transfection. Subsequent luciferase assays were performed 72 h after infection. (e) HepG2 cells were transfected by pSCT-SRA or control expression vector (200 ng), followed by T0070907 (0.4 μM) treatment immediately after transfection. 60 h later, cells were harvested for luciferase assay. (f) Hepa1-6 cells were infected with shRNA against SRA (shSRA) or scrambled shRNA as control (shControl). 12 h later, cells were treated with T0070907 (0.4 μM) for 60 h before harvesting. ATGL promoter driven luciferase activity were normalized to Renilla luciferase activity and presented as mean ± SE. Data are expressed as fold-change relative to the level of control. *p < 0.05.

