
Figure 2.
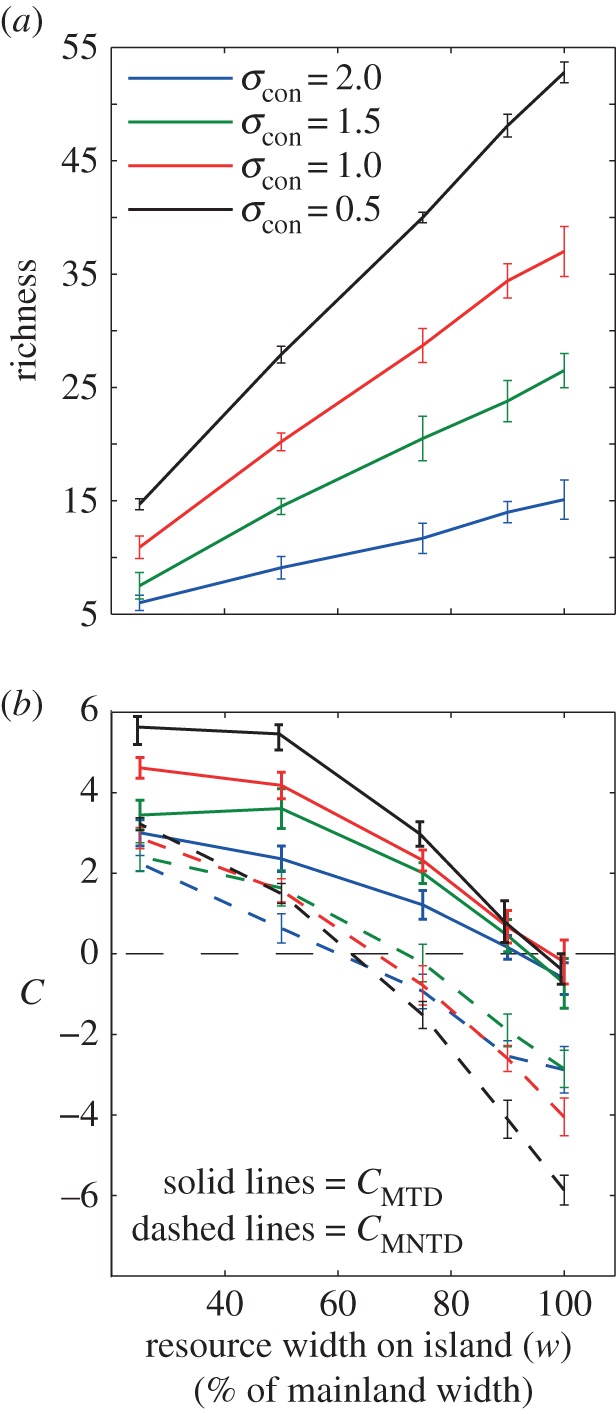
Mean (lines) and standard deviation (error bars) of consumer community richness (a) and trait clustering (C) based on MTD and MNTD (b) as a function of the overlap between resource width in trait space on the island and the trait distribution of competitor species. For the w = 100% scenario, all competitive consumers in the species pool have suitable resources in the island and could potentially invade (low degree of habitat filtering) while for the 25% scenario a small proportion could invade (high habitat filtering). Lines denote four levels of consumer niche width. Positive and negative clustering values indicate clustering and overdispersion, respectively. All results are based on 50 replicated simulations. Constant parameter values in our model that generated these results: r = 1, K = 300, bcon = 0.005, mcon = 0.1 and ccon = 0.15.