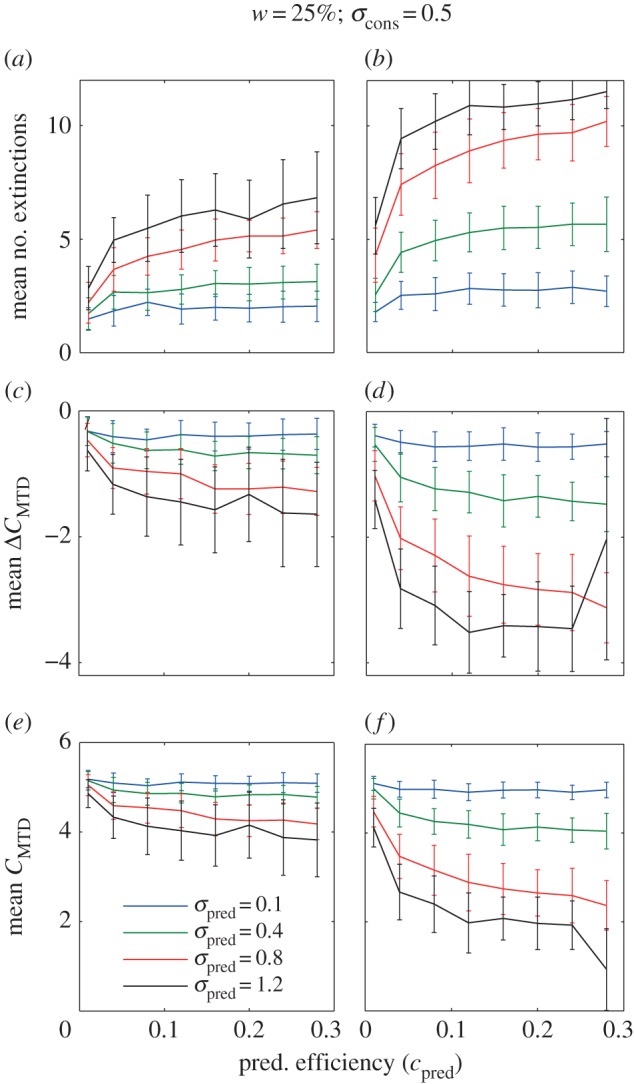
Figure 4.

The effect of one and three (columns) trophic consumers on the number of extinctions (row 1), change in community trait clustering C (row 2) and community clustering C after predator invasion (row 3). All C-values are based on MTD. Here the reference consumer community has a high degree of clustering (see the electronic supplementary material, appendix 1, figure S3, resource width on the island = 25% and consumer niche width = 0.5). Lines and error bars represent the mean and standard deviation for 50 replicated simulations. A fine-grained parameter space resolution of these results also including invasions of one to five predators are in the electronic supplementary material, appendix 1, figure S5. Positive and negative clustering values indicate clustering and overdispersion, respectively. Constant parameter values in our model that generated these results: r = 1, K = 300, bcon = 0.005, mcon = 0.1, ccon = 0.15 mpred = 0.1 and cpred = 0.15.
