Figure 5.
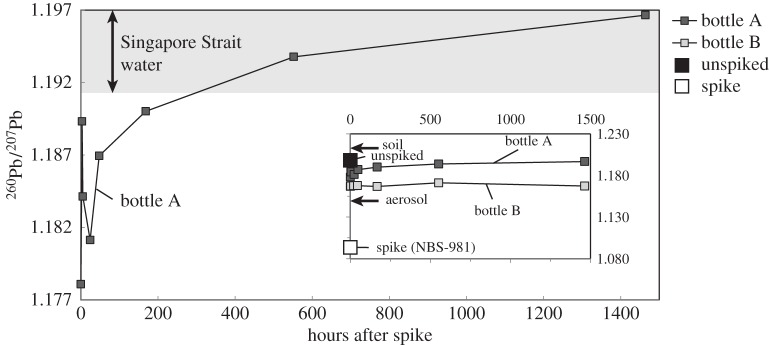
The measured 206Pb/207Pb ratios of seawater after spiking with NBS-981 standard reference material (big open square). The main figure shows the detailed change in 206Pb/207Pb in the unfiltered bottle A (grey filled squares) after spike addition with the shaded area indicating the range of 206Pb/207Pb in Singapore Strait water. The inset figure shows the overview of the 206Pb/207Pb in unfiltered sample (big filled square), spike (big open square), the change in 206Pb/207Pb ratios in the unfiltered bottle A and filtered bottle B (filtered at t = 0, open squares). The two arrows in the inset figure illustrate the average 206Pb/207Pb in Singapore aerosol and natural regional soil.

