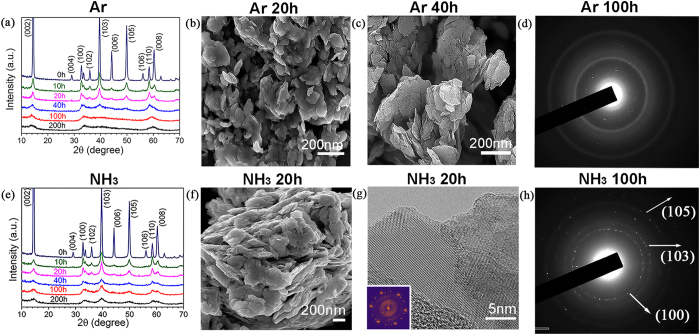
Figure 3. Different structural changes of molybdenum disulfide (MoS2) during ball milling in different gases.
(a) XRD patterns of MoS2 after milling in Ar gas for different periods of time; (b,c) SEM images of MoS2 after milling in Ar gas for different periods of time; (d) TEM micro-diffraction pattern of the sample after milling in Ar for 100 hours; (e) XRD patterns of MoS2 after milling in NH3 gas for different periods of time; (f) SEM image of MoS2 after milling in NH3 gas for 20 hours; (g) TEM image of MoS2 milled for 20 hours in NH3. Inset shows SAED pattern. (h) TEM microdiffraction pattern of the sample after milling in NH3 for 100 hours.

