
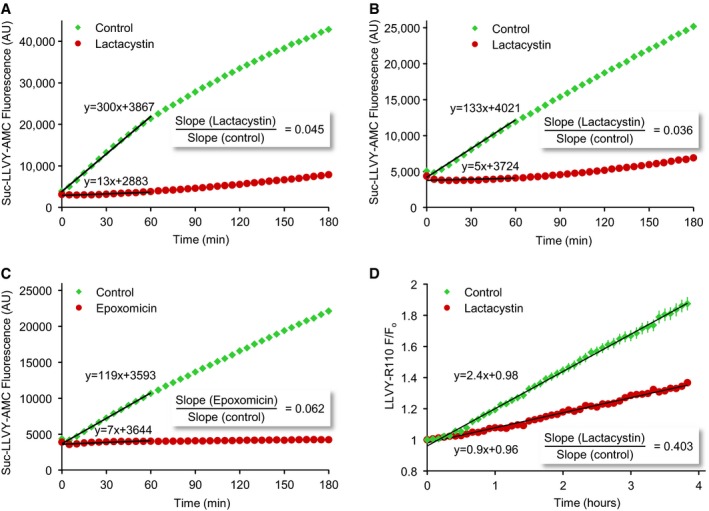
Figure EV1. Measuring proteasomal inhibition using fluorogenic substrates.
-
A, BCortical neurons grown for 2 weeks in culture were treated with lactacystin (10 μM) or carrier solution for 4 h, washed vigorously with PBS after which they were extracted, and assayed for proteasomal (chymotrypsin‐like) proteolytic activity using the fluorogenic substrate Suc‐LLVY‐AMC (see Materials and Methods for further details). Linear fits to the first hour are shown as black lines. Fit parameters are displayed next to lines. Two separate experiments. Y‐axis, arbitrary fluorescence units.
-
CSame as in (A) and (B) except that cells were treated here with epoxomicin (5 μM).
-
DProteasomal inhibition measured with fluorogenic substrates in living neurons. Cortical neurons were treated with lactacystin (10 μM) or carrier solution for 4 h, after which they were exposed to LLVY‐Rhodamine‐110 and followed by time‐lapse microscopy. Fluorescence was thereafter measured in neuronal cell bodies of neurons. Note that the fluorescence began to increase only after ˜30 min. Linear fits are shown as black lines. Fit parameters are displayed next to lines. Average and SEM for 121 cells from four experiments.