
Figure 3. Snap29 depletion affects mitotic progression.
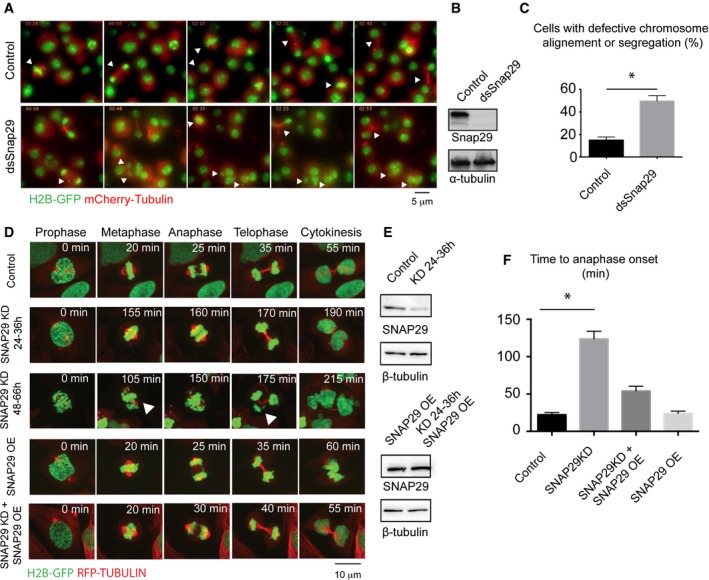
- Selected frames of time‐lapse imaging of control S2 cells or cells treated for 96 h with dsRNA against the central portion of Snap29. Note that depleted cells do not display a recognizable metaphase plate, or fail to segregate all chromosomes correctly, or form tripolar spindles or micronuclei (arrowheads; arrowheads in control point to cells dividing normally).
- Western blotting of extract from control cells and cells depleted of Snap29 (dsSnap29) relative to the experiment in (A).
- Quantification of the mitotic phenotype of control and dsSnap29‐depleted cells, based on time‐lapse imaging of an average of > 28 individual cells per sample. The mean with standard error of the mean (SEM) is shown, and P‐value is determined by two‐tailed t‐test considering all defects together. *P ≤ 0.05.
- Selected frames of time‐lapse imaging of control U2OS cells and U2OS cells treated for the indicated time. Note that the depleted cell at 48–66 h display altered metaphase plate and chromosome segregation (arrowheads).
- Western blot analysis of extracts relative to the experiments in (D).
- Quantification of the time from prophase to entry in anaphase based on analysis of > 20 individual cells/sample by time‐lapse microscopy. The mean with standard error of the mean (SEM) is shown, and P‐values are determined by Kruskal–Wallis test with Dunn's multiple comparison analysis. *P ≤ 0.05. OE: overexpression.