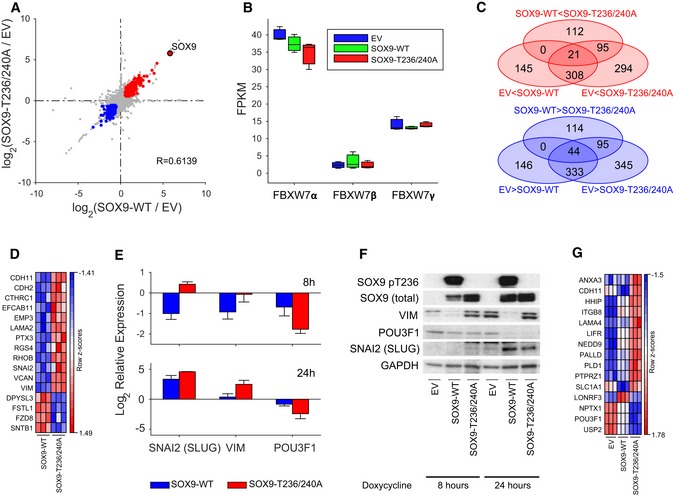
Figure 5. RNA‐Seq profiling of MB002 cells expressing SOX9‐WT and FBW7‐insensitive SOX9 mutant.

- Scatter plot depicting the relationship between transcriptional changes measured as log2 FC between EV to SOX9‐WT (x‐axis) and EV to SOX9‐T236/T240A (y‐axis). Each dot represents one transcript, with colored dots indicating transcripts upregulated (log2 FC > 0.585; P < 0.05; red dots) or downregulated (log2 FC < −0.585; P < 0.05; blue dots) in both comparisons. The transcript corresponding to the SOX9 gene is highlighted as a red filled dot. Indicated R‐value indicates Spearman's rank correlation coefficient between the two FC profiles.
- Box‐and‐whisker plot displaying the sample specific expression of three FBW7 isoforms: FBW7α (NM_033632), FBW7β (NM_018315), and FBW7γ (NM_001013415'). Each box represents the expression distribution over three replicates. The horizontal line inside each box represents the median value, lower and upper box borders display the 25th and 75th percentiles, respectively, and the interval between the two whiskers includes all non‐outlier values.
- Venn diagram illustrating the overlap of differentially expressed (FC > 1.5, P < 0.05) transcripts between any of the three comparisons: EV to SOX9‐WT (upregulated: 145 + 308 + 21; downregulated 146 + 333 + 44), EV to SOX9‐T236/T240A (upregulated: 294 + 308 + 95 + 21; downregulated 345 + 333 + 95 + 44), or SOX9‐WT to SOX9‐T236/T240A (upregulated: 112 + 95 + 21; downregulated 114 + 95 + 44). Each oval represents the number of transcripts either upregulated or downregulated in the respective comparison, where the direction of differential expression is indicated by the inequality sign in the label. Numbers in overlapping regions signify the number of transcripts commonly differentially expressed in all contributing comparisons.
- Heat map of the row‐wise z‐scores of 16 EMT hallmark genes in SOX9‐WT and SOX9‐T236/T240A samples. Heat map was generated using the GenePattern software (Reich et al, 2006).
- Quantitative PCR (qPCR) of SNAI2 (SLUG), VIM, and POU3F1 (OCT6) (normalized to GAPDH levels) in MB002 cells stably transduced with EV (set to 1), SOX9‐WT, and SOX9‐T236/240A. Cells were induced for 8 or 24 h with doxycycline. The data shown represents mean expression values and error bars indicate the standard error of the mean.
- Western blot of SOX9, HA‐SOX9, pSOX9‐T236, SNAI2 (SLUG), VIM, and POU3F1 (OCT6) in MB002 cells stably transduced with EV, SOX9‐WT, and SOX9‐T236/240A. Cells were induced for 24 and 48 h with doxycycline, and GAPDH was used as a loading control.
- Heat map of the row‐wise z‐scores of 14 pro‐metastasis genes differentially expressed between SOX9‐WT and SOX9‐T236/T240A samples and previously identified as SOX9 target genes (Kadaja et al, 2014; Oh et al, 2014; Larsimont et al, 2015). Heat map was generated using the GenePattern software (Reich et al, 2006).
