
Figure EV1. Analysis of D391N DIS3L2 CLIP.
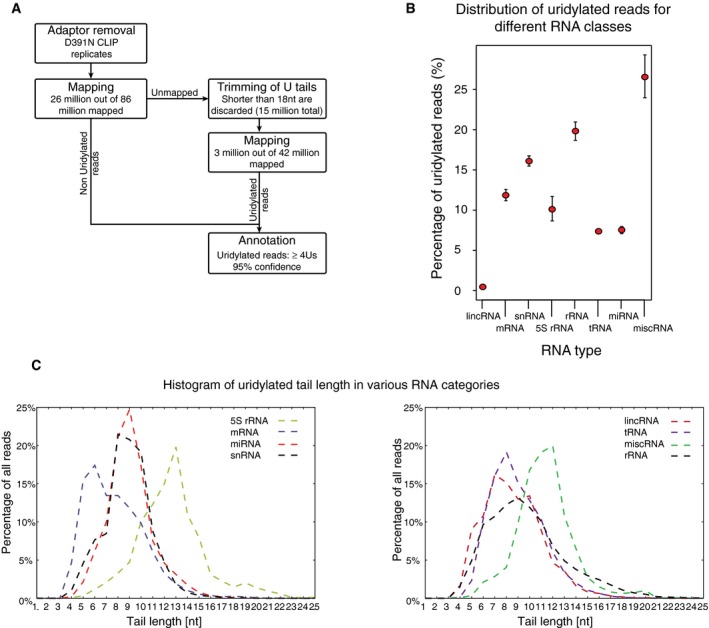
- Schematic representation of CLIP data analysis.
- Percentage of uridylated reads with at least 4Us for various functional categories of RNAs.
- Distribution of untemplated oligo(U) extension lengths for reads in various RNA annotation categories.