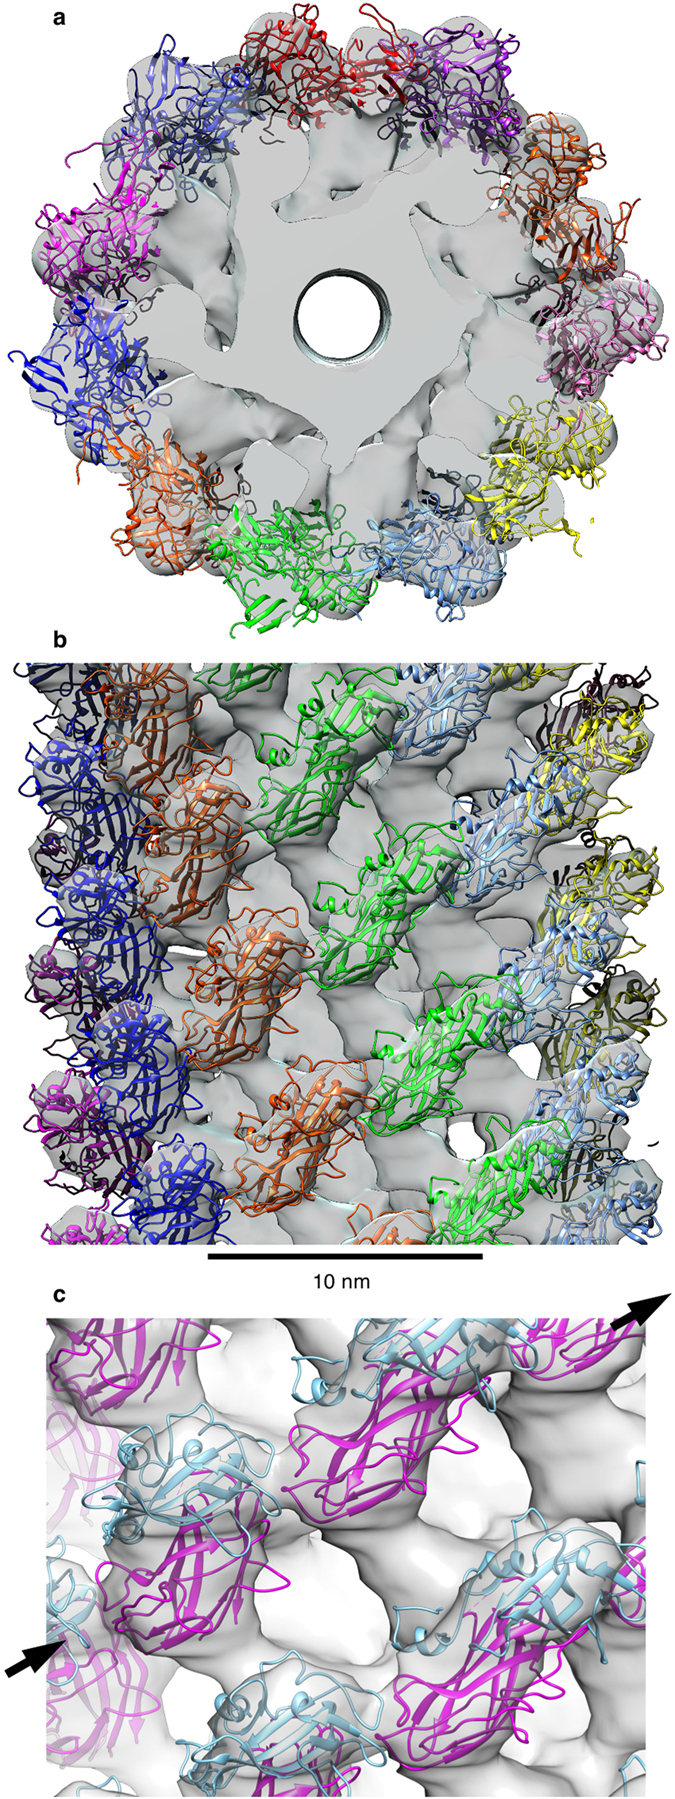
Figure 2. Manual docking of domains D2 and D3 of the hook protein, FlgE, of C. crescentus into the density map of the hook obtain by electron microscopy.

(a) Top view from the distal end. Each protofilament has a different colour. The central channel is visible in the middle. (b) Side view of the hook with domains D2 and D3. Each colour represents a different protofilament. Domains D0 and D1, which are missing in the crystal structure, should fill the unoccupied density in the map of the hook. (c) D3-D2 domain interaction in the model of the hook protofilament. Interaction in the 6-start direction indicated by the black arrow between D3 (cyan) and D2 (magenta) domains.
