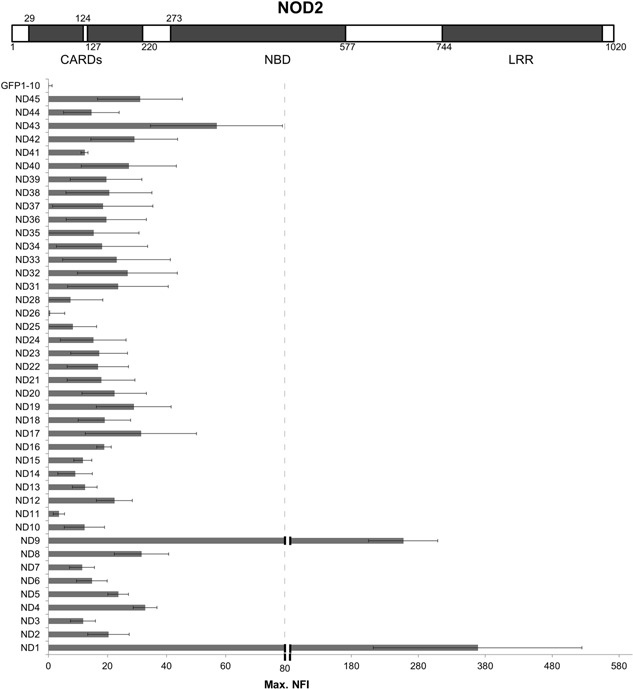
Figure 3.

Relative NFI levels of the NOD2 constructs. A schematic representation of the NOD2 protein with predicted domain boundaries is shown. Forty‐two different NOD2 constructs with different boundaries were designed and fused to splGFP11. The SplitGFP screen in the BioLector showed the difference in expression level for each construct. The diagram below depicts the average max. NFI of at least three or more BioLector measurements.
