
Figure 4.
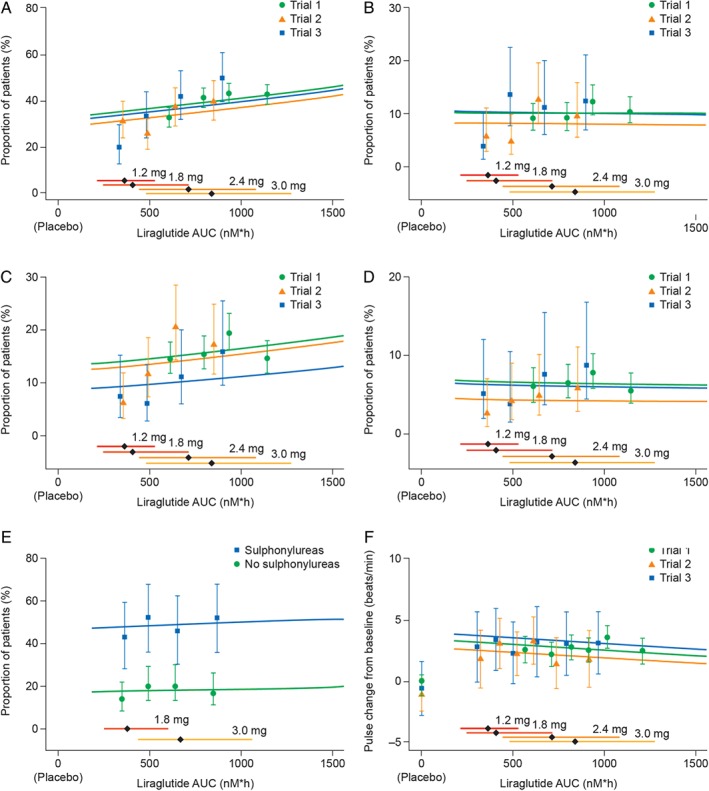
Liraglutide exposure and key safety outcomes. Liraglutide exposure expressed as model‐derived area under the curve (AUC) at steady‐state versus key safety outcomes, proportion of participants with (A) all incidences of nausea; (B) moderate–severe nausea; (C) all incidences of vomiting; (D) moderate–severe vomiting; (E) documented symptomatic hypoglycaemia (glucose ≤ 70 mg/dl); (F) change from baseline in mean resting pulse. Data are proportion of individuals who report an event at any time during the trial (A–E) or mean change in pulse from baseline (F), all with 95% confidence interval, versus exposure (in quantiles of AUC). Lines (exposure–response relationship for each trial) represent a multivariate regression analysis for the pooled data. Horizontal bars with diamonds represent median and 90% exposure ranges. Liraglutide doses were: 3.0 mg in Trial 1; 1.8 and 3.0 mg in Trial 2; 1.2 mg, 1.8 mg, 2.4 mg and 3.0 mg in Trial 3. Trial 1, SCALE Obesity and Prediabetes; Trial 2, SCALE Diabetes; Trial 3, the phase II trial.