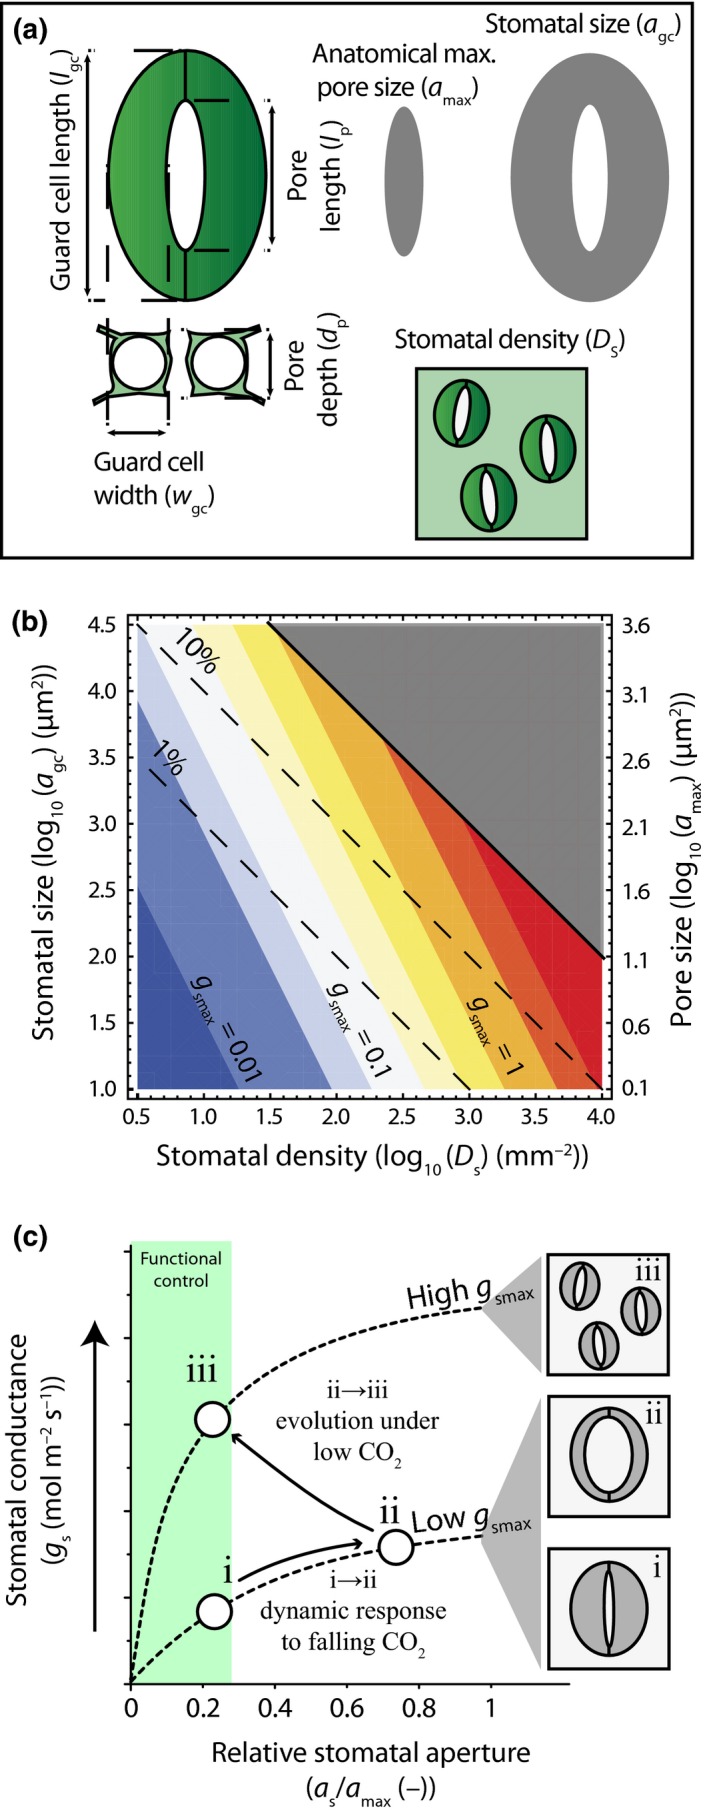
Figure 1.

Theoretical relationships between morphological stomatal traits and leaf gas exchange. (a) Schematized stomatal morphology following Lawson et al. (1998) and the specific stomatal traits considered in this study. Stomatal size (a gc) and anatomical maximum pore size (a max) are indicated with grey shapes. (b) Theoretical relationship between the leaf epidermal area fraction allocated to stomata (f gc) (dashed lines and expressed as %) and the anatomical maximum stomatal conductance (g smax) (shaded colours and expressed as mol m−2 s−1). The f gc is expressed as a function of log10‐transformed values of stomatal density (D s) and a gc, whereas g smax is expressed as a function of log10‐transformed values of D s and a max (plotted on the 2nd y‐axis). A constant ratio between a max and a gc of 0.12 (Franks & Beerling, 2009) is assumed for plotting, although this ratio may change depending on stomatal morphology (Franks et al., 2014). (c) Schematic response of stomatal conductance (g s) to a short‐term decrease in atmospheric CO 2 (Farquhar & Sharkey, 1982) before a long‐term decrease in atmospheric CO 2 (i → ii), and changes in a gc and D s during a long‐term decrease in atmospheric CO 2 concentration (Franks & Beerling, 2009) that restore functional control on g s by increasing g smax (Franks et al., 2012b) (ii → iii). The relative stomatal aperture is indicated by the ratio of stomatal aperture (∂ s) to ∂ max. The green area denotes the region where guard cells have most functional control on g s.
