
Figure 3.
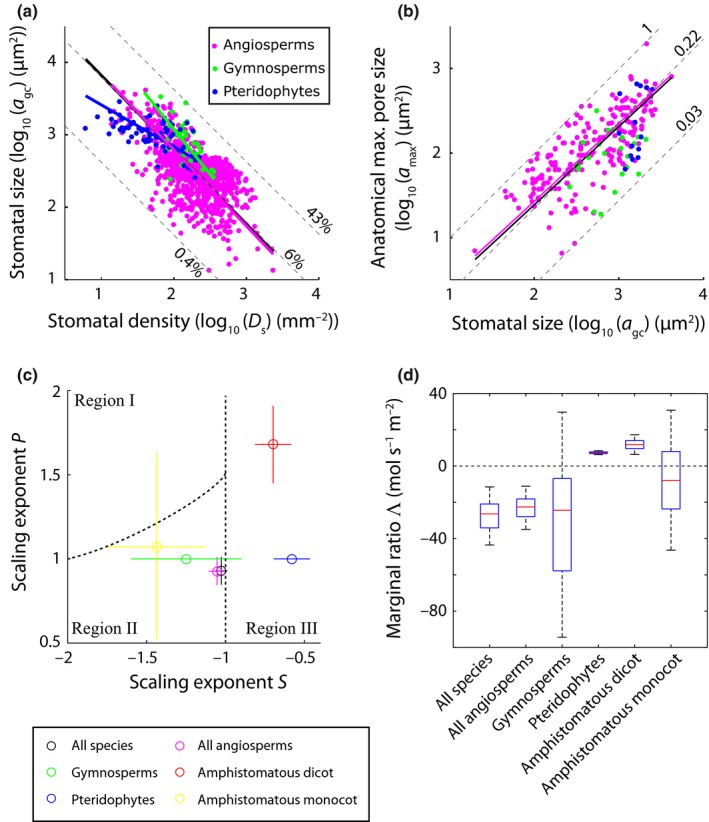
Allometric relationships between morphological stomatal traits. (a) Log10‐transformed values of D s and a gc and (b) a gc and a max. The solid black lines represent standardized major axis (SMA) regressions fitted on all species; the pink, green and blue lines denote the SMAs across subsets of angiosperm, gymnosperm and pteridophyte species, respectively. See Table 1 for detailed statistics. Maximum, median and minimum values of f gc (expressed as %), and the ratio a max : a gc are indicated by the dashed lines in (a) and (b), respectively. (c) Bootstrapped distributions of the scaling exponents S and P (Eqns 3 and 4, respectively) calculated across the distinct species subsets indicated by the differently coloured symbols. Confidence intervals indicate the 5th and 95th percentiles of the bootstrapped exponents. Dashed lines indicate the borders between the different scaling regions indicated in Fig. 2. (d) Distributions of the bootstrapped values of Λ considering all species present in the compiled dataset and distinct species subsets. The red line inside boxes indicates the median of the bootstrapped distribution, the bottom and top of each box denotes the first and third quartile, respectively, whiskers denote the 5th and 95th percentiles.