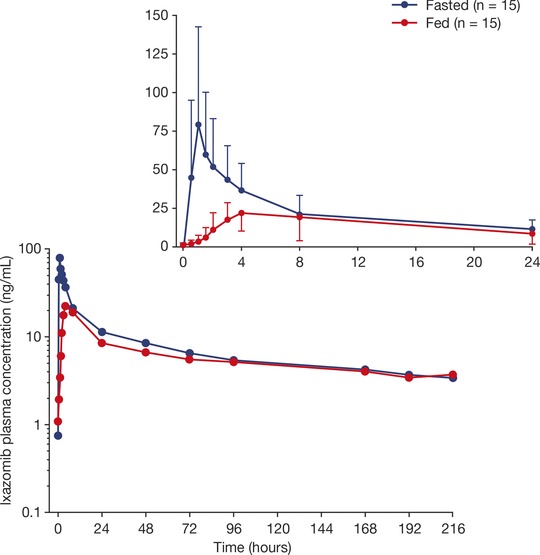
Figure 2.

Mean plasma concentration‐time profiles of ixazomib under fasted and fed conditions (n = 15). The inset shows the mean plasma ixazomib concentrations over the first 24 hours after dosing. Error bars in the inset figure indicate standard deviation.
