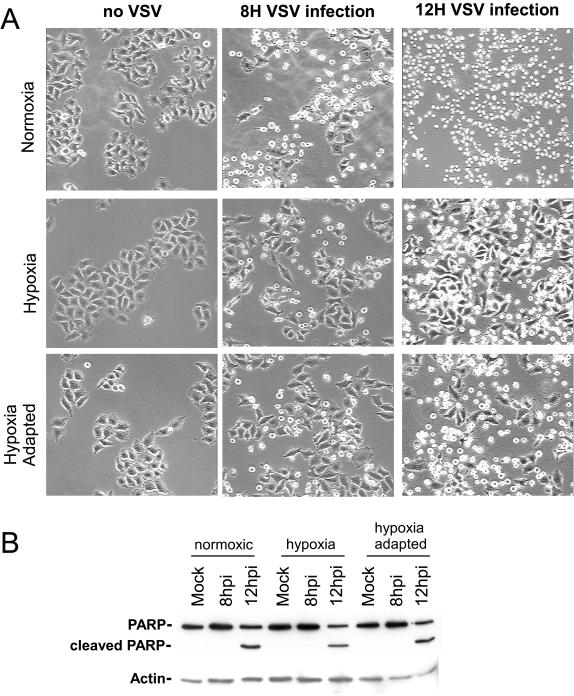
FIG. 5.
(A) Images of CPE from VSV infection in normoxia and hypoxia. Cells were mock infected or infected with VSV at an MOI of 10 under normoxic, hypoxic, or hypoxia-adapted conditions, and phase-contrast images were taken at 8 and 12 hpi (8H and 12H, respectively). The phase-contrast images shown are of a representative field and are representative of the results from three separate experiments. Magnification, ×20. (B) Analysis of PARP cleavage following VSV infection. Extracts from mock- and VSV-infected cells were analyzed by Western blotting (see Materials and Methods) with antibodies to PARP and actin. Images are representative of the results from two separate experiments.

