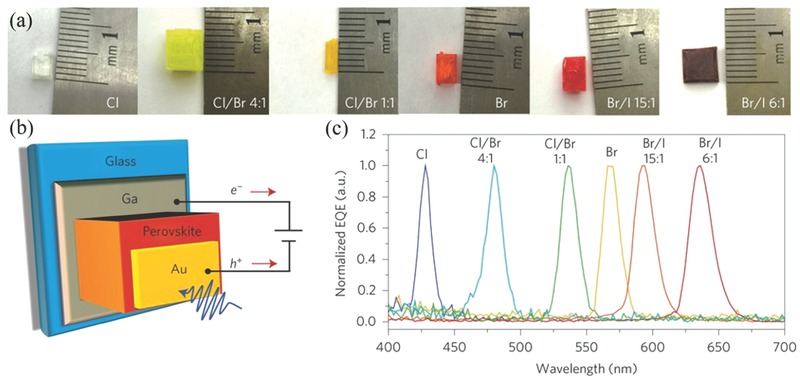
Figure 7.

a) Photographs of single‐halide and mixed‐halide perovskite single crystals with different halide compositions. b) Schematic of photodetector structure. c) Normalized EQE spectra of the single‐halide and mixed‐halide perovskite single‐crystal photodetectors with different halide compositions, showing the ultranarrow EQE peak and tunable spectral response. The EQE spectra were measured under −1 V bias. a–c)Reproduced with permission.121 Copyright 2015, Nature Publishing Group.
